📈 Support & Resistance Levels
Classic Pivot Points:
Resistance: ₹151.20 (R1), ₹156.15 (R2), ₹159.40 (R3)
Support: ₹139.75 (S1), ₹143.00 (S2), ₹134.80 (S3)
Pivot Point: ₹147.95
Fibonacci Levels:
Resistance: ₹151.08 (R1), ₹153.02 (R2), ₹156.15 (R3)
Support: ₹142.88 (S1), ₹144.82 (S2), ₹139.75 (S3)
Pivot Point: ₹147.95
Camarilla Levels:
Resistance: ₹147.00 (R1), ₹147.75 (R2), ₹148.50 (R3)
Support: ₹144.00 (S1), ₹144.75 (S2), ₹145.50 (S3)
Pivot Point: ₹147.95
📊 Technical Indicators
RSI (14-day): 44.06 — Neutral to slightly bearish
MACD: -0.840 — Bearish trend
Moving Averages:
20-day EMA: ₹135.67 — Neutral
50-day EMA: ₹127.34 — Neutral
100-day EMA: ₹121.00 — Uptrend
200-day EMA: ₹116.62 — Uptrend
🔍 Market Sentiment
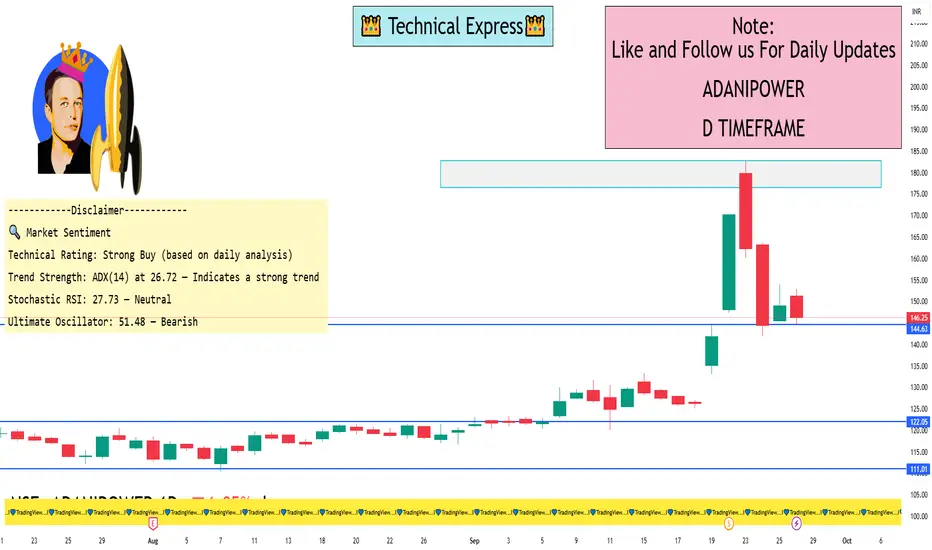
Technical Rating: Strong Buy (based on daily analysis)
Trend Strength: ADX(14) at 26.72 — Indicates a strong trend
Stochastic RSI: 27.73 — Neutral
Ultimate Oscillator: 51.48 — Bearish
📉 Recent Performance
Recent Decline: Adani Power reported a 15.5% decline in its first-quarter profit, with consolidated net earnings dropping to ₹33.05 billion from ₹39.13 billion the previous year. The decline is attributed to subdued power demand and increased coal import costs
📌 Conclusion
Adani Power is currently in a neutral to slightly bearish phase on the daily chart, with key support around ₹139.75 and resistance near ₹151.20. The technical indicators suggest a cautious outlook, with the RSI and MACD indicating a bearish trend. However, the strong trend strength (ADX) and positive moving averages indicate potential for upward movement if the stock breaks above resistance levels.
Classic Pivot Points:
Resistance: ₹151.20 (R1), ₹156.15 (R2), ₹159.40 (R3)
Support: ₹139.75 (S1), ₹143.00 (S2), ₹134.80 (S3)
Pivot Point: ₹147.95
Fibonacci Levels:
Resistance: ₹151.08 (R1), ₹153.02 (R2), ₹156.15 (R3)
Support: ₹142.88 (S1), ₹144.82 (S2), ₹139.75 (S3)
Pivot Point: ₹147.95
Camarilla Levels:
Resistance: ₹147.00 (R1), ₹147.75 (R2), ₹148.50 (R3)
Support: ₹144.00 (S1), ₹144.75 (S2), ₹145.50 (S3)
Pivot Point: ₹147.95
📊 Technical Indicators
RSI (14-day): 44.06 — Neutral to slightly bearish
MACD: -0.840 — Bearish trend
Moving Averages:
20-day EMA: ₹135.67 — Neutral
50-day EMA: ₹127.34 — Neutral
100-day EMA: ₹121.00 — Uptrend
200-day EMA: ₹116.62 — Uptrend
🔍 Market Sentiment
Technical Rating: Strong Buy (based on daily analysis)
Trend Strength: ADX(14) at 26.72 — Indicates a strong trend
Stochastic RSI: 27.73 — Neutral
Ultimate Oscillator: 51.48 — Bearish
📉 Recent Performance
Recent Decline: Adani Power reported a 15.5% decline in its first-quarter profit, with consolidated net earnings dropping to ₹33.05 billion from ₹39.13 billion the previous year. The decline is attributed to subdued power demand and increased coal import costs
📌 Conclusion
Adani Power is currently in a neutral to slightly bearish phase on the daily chart, with key support around ₹139.75 and resistance near ₹151.20. The technical indicators suggest a cautious outlook, with the RSI and MACD indicating a bearish trend. However, the strong trend strength (ADX) and positive moving averages indicate potential for upward movement if the stock breaks above resistance levels.
I built a Buy & Sell Signal Indicator with 85% accuracy.
📈 Get access via DM or
WhatsApp: wa.link/d997q0
Contact - +91 76782 40962
| Email: techncialexpress@gmail.com
| Script Coder | Trader | Investor | From India
📈 Get access via DM or
WhatsApp: wa.link/d997q0
Contact - +91 76782 40962
| Email: techncialexpress@gmail.com
| Script Coder | Trader | Investor | From India
Bài đăng liên quan
Thông báo miễn trừ trách nhiệm
Thông tin và các ấn phẩm này không nhằm mục đích, và không cấu thành, lời khuyên hoặc khuyến nghị về tài chính, đầu tư, giao dịch hay các loại khác do TradingView cung cấp hoặc xác nhận. Đọc thêm tại Điều khoản Sử dụng.