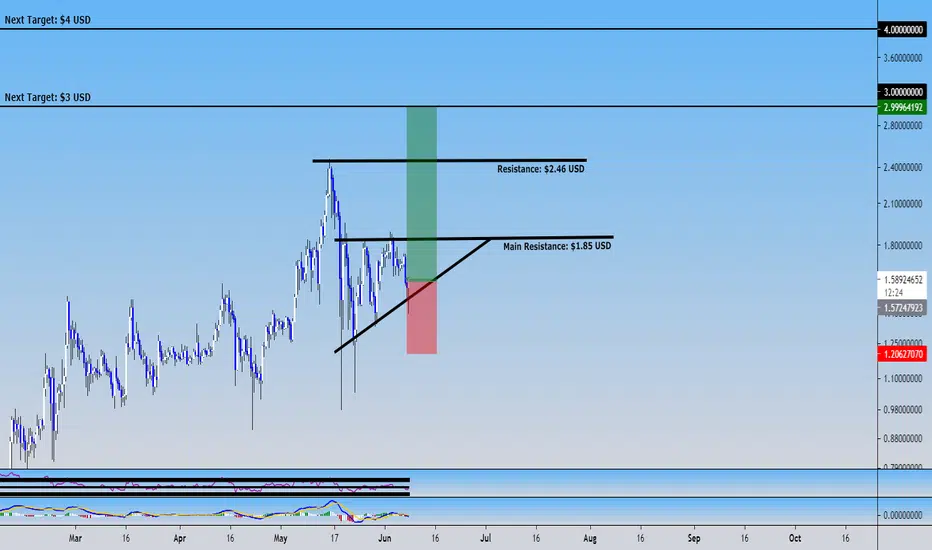
Yesterday, I sold 10,484 Cardano coins, but today, we see that Cardano down even in the $1.41 USD, but Cardano price it's right now above of $1.57 USD and make a rejection on this bearsih movement that we see. But we could to forming this ascending triangle that show us that our next target will be around of $3 USD. So guys, the time to accumulate Cardano it's now, becuase there's not any signal that Cardano going to down, but what we see in H12 timeframe it's a bullish hammer formation. For that, I will re-open my long position in Cardano until the $3 USD that will be my target, and my SL will be $1.20 USD. It;s a risk/benefit of 1:4
s3.tradingview.com/snapshots/e/enBfMjAE.png
And looking the Daily timeframe, I want to show you this timeframe because I see that Cardano forming a lower higher in this trend line and I show you 5 green arrow that make lower higher in the chart. And that will be a good signal that Cardano it's going to take a re-surge in this next volatile movement.
Now, I decide to re-buy again my Cardano coins to hold as I sell around of $1.59 USD. Now, I see that this drop was confused as we see that cryptocurrency today down, but some cryptocurrencies like Cardano make rejection, Cardano it's an example.
Thông báo miễn trừ trách nhiệm
Thông tin và ấn phẩm không có nghĩa là và không cấu thành, tài chính, đầu tư, kinh doanh, hoặc các loại lời khuyên hoặc khuyến nghị khác được cung cấp hoặc xác nhận bởi TradingView. Đọc thêm trong Điều khoản sử dụng.
Thông báo miễn trừ trách nhiệm
Thông tin và ấn phẩm không có nghĩa là và không cấu thành, tài chính, đầu tư, kinh doanh, hoặc các loại lời khuyên hoặc khuyến nghị khác được cung cấp hoặc xác nhận bởi TradingView. Đọc thêm trong Điều khoản sử dụng.