Greetings Traders,
Today, we’re taking a closer look at ADIB (Abu Dhabi Islamic Bank) — an interesting setup forming on the chart!
Key Highlights:
Keep an eye on volume during the breakout — confirmation is key.
Happy Trading & Stay Disciplined!
Today, we’re taking a closer look at ADIB (Abu Dhabi Islamic Bank) — an interesting setup forming on the chart!
Key Highlights:
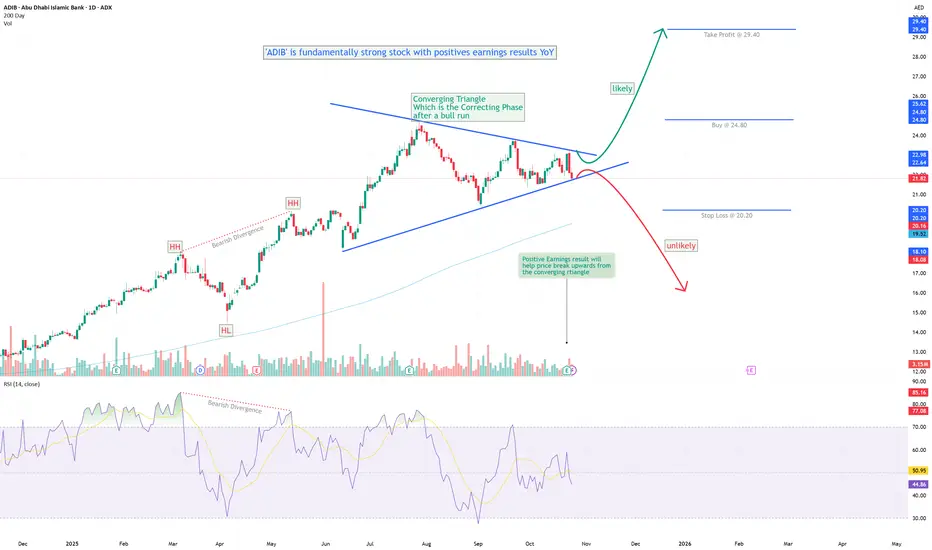
- Fundamentally strong: ADIB continues to deliver solid YoY earnings growth.
- Bearish divergence was observed earlier, leading to strong selling pressure, followed by the formation of a converging triangle pattern.
- This triangle appears to represent a corrective phase after a prolonged bullish rally.
- The stock recently announced positive earnings results, reinforcing the underlying strength.
- Considering the technical and fundamental setup, a bullish breakout from the triangle looks probable.
- Trading Plan: Wait for a confirmed breakout above the upper trendline before entering a cautious long position. Traders can take a risky position after break-out of triangle. And for Cautious traders wait for the breakout from the upper tip of the triangle.
- Stop Loss: Below the recent swing low.
Keep an eye on volume during the breakout — confirmation is key.
Happy Trading & Stay Disciplined!
Thông báo miễn trừ trách nhiệm
Thông tin và các ấn phẩm này không nhằm mục đích, và không cấu thành, lời khuyên hoặc khuyến nghị về tài chính, đầu tư, giao dịch hay các loại khác do TradingView cung cấp hoặc xác nhận. Đọc thêm tại Điều khoản Sử dụng.
Thông báo miễn trừ trách nhiệm
Thông tin và các ấn phẩm này không nhằm mục đích, và không cấu thành, lời khuyên hoặc khuyến nghị về tài chính, đầu tư, giao dịch hay các loại khác do TradingView cung cấp hoặc xác nhận. Đọc thêm tại Điều khoản Sử dụng.