API3 has been sideways for 196 days, 6.5 months, a very long time. It is interesting to notice the final portion of the bearish wave is part of the sideways phase. Between 3-February and 11-March.
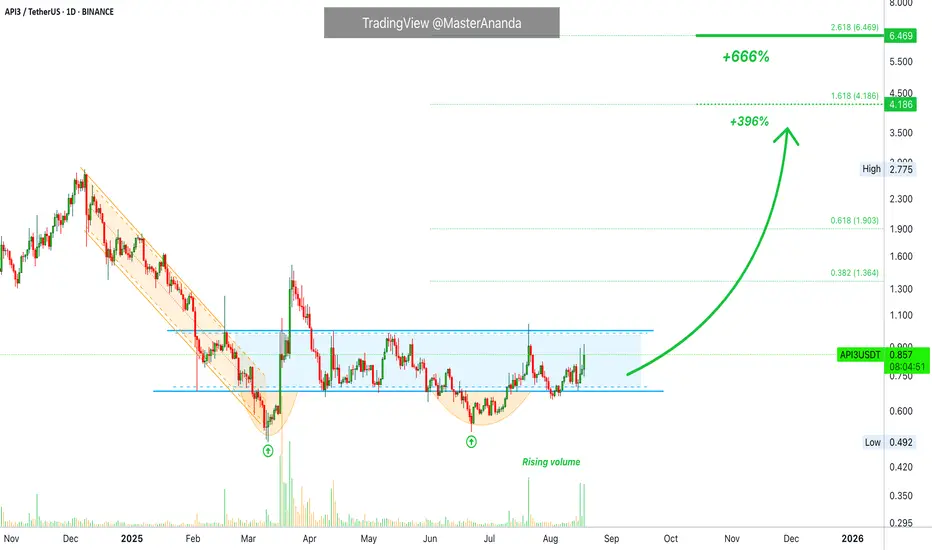
API3USDT has been quiet for months. Only neutral action. Sideways.
There is first a higher low. The first signal that shows up after the correction bottom. After the higher low we have rising volume. So the market is sideways but pointing higher. Buying is happening behind the scenes and sellers cannot reach support. When selling happens, buyers are present and all selling is consumed. This is all bullish and points toward higher prices.
MA200
API3 is moving above MA200 today and this is the most important signal of all.

The last time this event happened, coming from a low, was in October 2023. This was also the start of the last bullish wave. Right before a major bullish cycle, the action moves above MA200 daily.

This is a nice chart setup. The targets here are meant for the mid-term to long-term.
There can be more if we focus on the bigger picture. This should only be a portion of the 2025 bull market growth and profits potential.
Thank you for reading.
Namaste.
API3USDT has been quiet for months. Only neutral action. Sideways.
There is first a higher low. The first signal that shows up after the correction bottom. After the higher low we have rising volume. So the market is sideways but pointing higher. Buying is happening behind the scenes and sellers cannot reach support. When selling happens, buyers are present and all selling is consumed. This is all bullish and points toward higher prices.
MA200
API3 is moving above MA200 today and this is the most important signal of all.
The last time this event happened, coming from a low, was in October 2023. This was also the start of the last bullish wave. Right before a major bullish cycle, the action moves above MA200 daily.
This is a nice chart setup. The targets here are meant for the mid-term to long-term.
There can be more if we focus on the bigger picture. This should only be a portion of the 2025 bull market growth and profits potential.
Thank you for reading.
Namaste.
🚨 Get the FULL (6-in-1) PREMIUM PACKAGE
lamatrades.com —Since 2017
🚨 TOP Results: ZEC +2736% · ETH +2150%, CRO +1272%, AAVE +1134%, DOGS +868%, SOL +861%, XRP +749%, BTC +580%
More 👉 t.me/masteranandatrades/6681
lamatrades.com —Since 2017
🚨 TOP Results: ZEC +2736% · ETH +2150%, CRO +1272%, AAVE +1134%, DOGS +868%, SOL +861%, XRP +749%, BTC +580%
More 👉 t.me/masteranandatrades/6681
Bài đăng liên quan
Thông báo miễn trừ trách nhiệm
Thông tin và các ấn phẩm này không nhằm mục đích, và không cấu thành, lời khuyên hoặc khuyến nghị về tài chính, đầu tư, giao dịch hay các loại khác do TradingView cung cấp hoặc xác nhận. Đọc thêm tại Điều khoản Sử dụng.