APL Apollo Tubes Ltd – Weekly Chart Update: Breakout from Multi-Period Consolidation
Technical Structure:
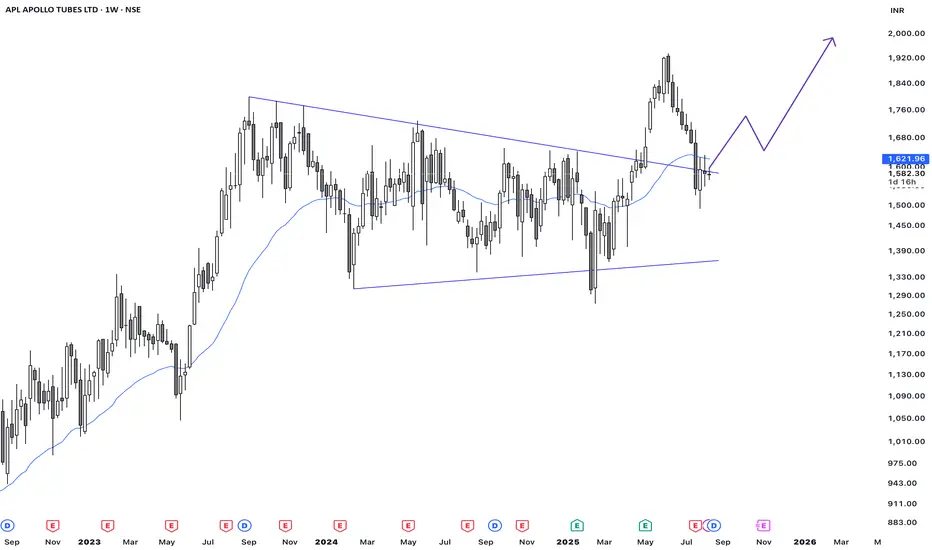
The chart clearly shows a long consolidation between early 2023 and mid‑2025, bounded by converging trend lines forming a symmetrical wedge/triangle.
Recently, price decisively broke above the upper trendline, accompanied by a volume spike, signaling a classic bullish breakout scenario. A subsequent retest of the breakout zone (~₹1,580–1,600) appears to be underway—buyers holding this zone could pave the way for a continued rally .
Potential Targets and Setup:
• Entry Zone: Weekly close above 34 week moving average
• SL on entry: 1485
• First target: 1900
• If momentum sustains, keep trailing SL
• Invalidation: SL is hit or any opposing bearish signal on chart
Fundamentals:
• The technical breakout aligns with healthy fundamentals—strong ROCE/ROE and sustained revenue growth.
• Though valuations are rich (P/E ~55x, P/B ~10x), the quality of earnings and performance metrics justify the multiple.
Technical Structure:
The chart clearly shows a long consolidation between early 2023 and mid‑2025, bounded by converging trend lines forming a symmetrical wedge/triangle.
Recently, price decisively broke above the upper trendline, accompanied by a volume spike, signaling a classic bullish breakout scenario. A subsequent retest of the breakout zone (~₹1,580–1,600) appears to be underway—buyers holding this zone could pave the way for a continued rally .
Potential Targets and Setup:
• Entry Zone: Weekly close above 34 week moving average
• SL on entry: 1485
• First target: 1900
• If momentum sustains, keep trailing SL
• Invalidation: SL is hit or any opposing bearish signal on chart
Fundamentals:
• The technical breakout aligns with healthy fundamentals—strong ROCE/ROE and sustained revenue growth.
• Though valuations are rich (P/E ~55x, P/B ~10x), the quality of earnings and performance metrics justify the multiple.
Thông báo miễn trừ trách nhiệm
Thông tin và các ấn phẩm này không nhằm mục đích, và không cấu thành, lời khuyên hoặc khuyến nghị về tài chính, đầu tư, giao dịch hay các loại khác do TradingView cung cấp hoặc xác nhận. Đọc thêm tại Điều khoản Sử dụng.
Thông báo miễn trừ trách nhiệm
Thông tin và các ấn phẩm này không nhằm mục đích, và không cấu thành, lời khuyên hoặc khuyến nghị về tài chính, đầu tư, giao dịch hay các loại khác do TradingView cung cấp hoặc xác nhận. Đọc thêm tại Điều khoản Sử dụng.