Hello?
Traders, welcome.
If you "Follow", you can always get new information quickly.
Please also click "Boost".
Have a good day.
** Analysis of the BTC chart publishes new ideas once a week.
** However, we publish new ideas when volatility occurs or when we show signs of diverging from our expectations.
** Excluding the above situation, BTC analysis is listed as a daily update.
-------------------------------------
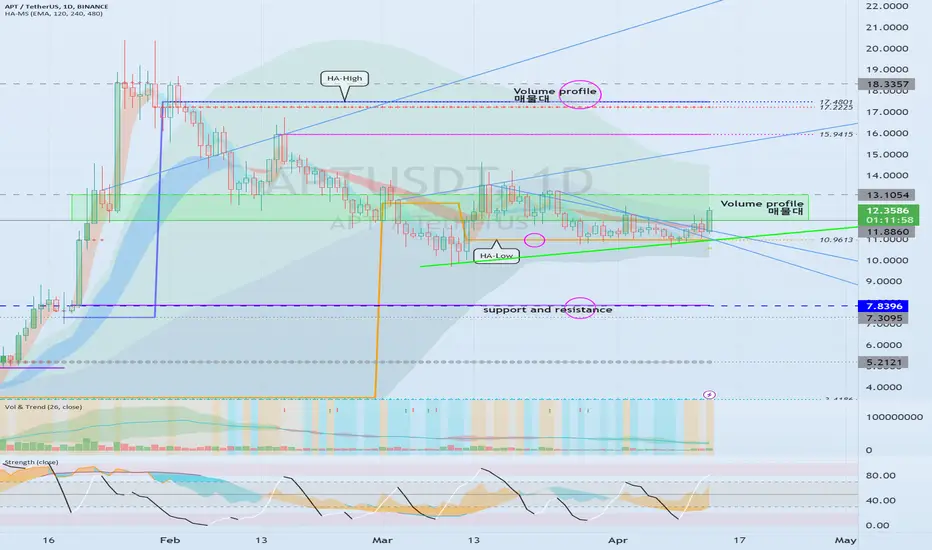
(APTUSDT chart)

The key is whether it can rise above the volume profile section formed in the 11.8860-13.1054 section.
If it declines, you should check for support around 7.8396.
Since it was supported and rose near the HA-Low indicator of the 1D chart, if it rises above the selling range of 11.8860-13.1054, it is expected to rise to the vicinity of the HA-High indicator of the 1D chart.
However, it may be created by moving the HA-High indicator as it rises.
-------------------------------------------------- -------------------------------------------
** All descriptions are for reference only and do not guarantee profit or loss in investment.
** Even if you know other people's know-how, it takes a considerable period of time to make it your own.
** This is a chart created with my know-how.
---------------------------------
Traders, welcome.
If you "Follow", you can always get new information quickly.
Please also click "Boost".
Have a good day.
** Analysis of the BTC chart publishes new ideas once a week.
** However, we publish new ideas when volatility occurs or when we show signs of diverging from our expectations.
** Excluding the above situation, BTC analysis is listed as a daily update.
-------------------------------------
(APTUSDT chart)
The key is whether it can rise above the volume profile section formed in the 11.8860-13.1054 section.
If it declines, you should check for support around 7.8396.
Since it was supported and rose near the HA-Low indicator of the 1D chart, if it rises above the selling range of 11.8860-13.1054, it is expected to rise to the vicinity of the HA-High indicator of the 1D chart.
However, it may be created by moving the HA-High indicator as it rises.
-------------------------------------------------- -------------------------------------------
** All descriptions are for reference only and do not guarantee profit or loss in investment.
** Even if you know other people's know-how, it takes a considerable period of time to make it your own.
** This is a chart created with my know-how.
---------------------------------
※ Follow X to check out the posts.
※ X를 팔로우하고 게시물을 확인하세요.
◆ t.me/readCryptoChannel
[HA-MS Indicator]
bit.ly/3YxHgvN
[OBV Indicator]
bit.ly/4dcyny3
※ X를 팔로우하고 게시물을 확인하세요.
◆ t.me/readCryptoChannel
[HA-MS Indicator]
bit.ly/3YxHgvN
[OBV Indicator]
bit.ly/4dcyny3
Bài đăng liên quan
Thông báo miễn trừ trách nhiệm
Thông tin và ấn phẩm không có nghĩa là và không cấu thành, tài chính, đầu tư, kinh doanh, hoặc các loại lời khuyên hoặc khuyến nghị khác được cung cấp hoặc xác nhận bởi TradingView. Đọc thêm trong Điều khoản sử dụng.