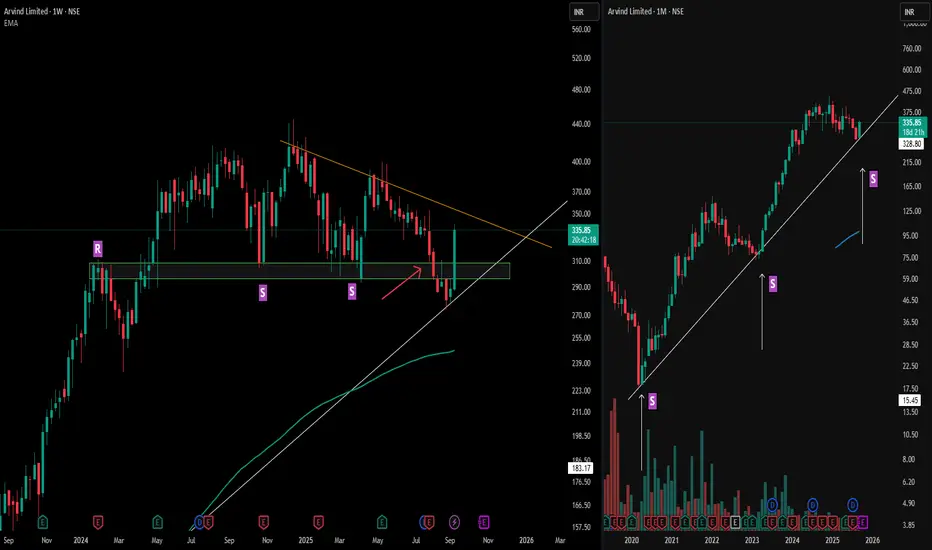
Arvind Limited highlights how a broader perspective can clarify deceptive price moves.
On the left (weekly), resistance ("R") flipped into support ("S") multiple times, with the orange counter trendline framing the recent structure. The red arrow marks a moment when weekly support appeared broken—a classic fake breakdown as price quickly reclaimed the zone with decisive strength.
Looking right (monthly), the MTFA view explains the recovery: a long-standing trendline support anchors the zone, helping absorb downside attempts and fueling the swift reversal. This alignment across timeframes illustrates how long-term technical structures often override short-term volatility, and why reviewing bigger picture charts is essential for pattern validation—not for prediction.
Disclaimer: This analysis is for educational purposes only and does not constitute investment advice. Always do your own research before making financial decisions.
🎯 Master My Self-Made Trading Strategy
📈 Telegram (Learn Today): t.me/hashtaghammer
✅ WhatsApp (Learn Today): wa.me/919455664601
📈 Telegram (Learn Today): t.me/hashtaghammer
✅ WhatsApp (Learn Today): wa.me/919455664601
Bài đăng liên quan
Thông báo miễn trừ trách nhiệm
Thông tin và các ấn phẩm này không nhằm mục đích, và không cấu thành, lời khuyên hoặc khuyến nghị về tài chính, đầu tư, giao dịch hay các loại khác do TradingView cung cấp hoặc xác nhận. Đọc thêm tại Điều khoản Sử dụng.