Description:
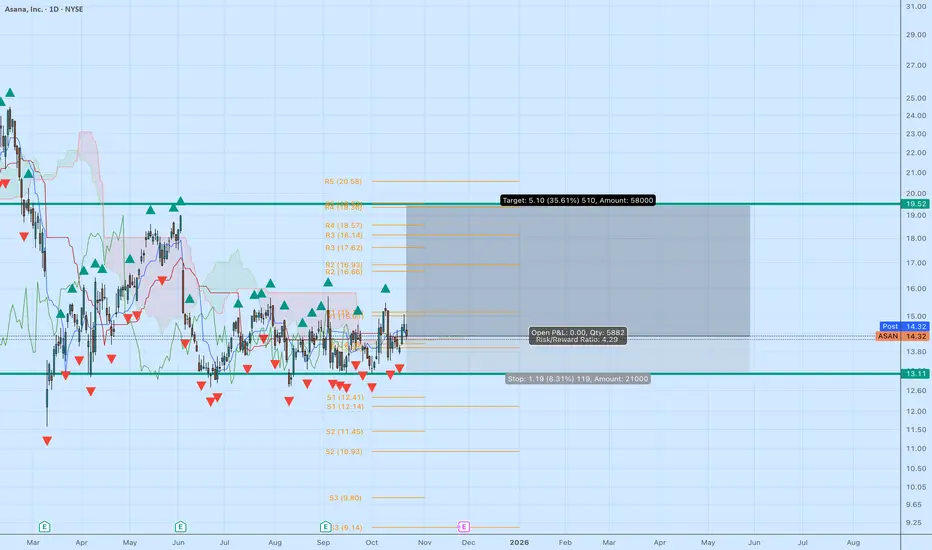
Asana (ASAN) is consolidating tightly around $14.30, coiling beneath key resistance and showing early signs of a potential breakout. Price is now sitting right at the Kijun and Tenkan cross zone, with the Ichimoku Cloud flattening and narrowing — a setup that often precedes trend expansion.
Technical Breakdown:
Ichimoku: Price testing the underside of the cloud. A clean close above $14.70–$15.00 with volume would confirm a bullish Kumo breakout. Span A is beginning to turn upward, while Lagging Span (Chikou) is approaching a clear path above price — an early bullish signal.
Support: $13.10 (base floor)
Resistance: $14.90 → $17.60 → $19.50
Stop: Below $13.00
Target Zone: $17.00 (analyst avg) → $19.50 (upper technical target)
Risk/Reward: ~4.2 : 1
RSI: Neutral at ~55 — plenty of room for expansion.
Volume: Accumulation phase showing upticks on green candles.
Analyst Consensus:
Average 12-month price target: $17.00 (+18% upside).
High-end estimates: $20–21, aligning with the top of the current resistance band.
Analysts maintain a “Hold / Modest Buy” stance, but improving enterprise adoption and potential margin expansion through AI-driven efficiency remain catalysts into 2026.
Trade Plan:
▶ Watch for a daily close above $15 to confirm breakout.
▶ Initial target $17, extended $19.50.
▶ Stop below $13.00 to protect capital.
▶ If breakout holds, consider trailing stops or layering covered calls above $19–$20.
This setup offers asymmetric reward potential for traders anticipating a late-year software rebound as sentiment shifts back toward SaaS names.
Giao dịch đang hoạt động
If you found my trades helpful, please consider sending a tip in BTC to: bc1qr35mrh82hykpy9v6znpsyuew85x84ezjyrrf6m
Thông báo miễn trừ trách nhiệm
Thông tin và ấn phẩm không có nghĩa là và không cấu thành, tài chính, đầu tư, kinh doanh, hoặc các loại lời khuyên hoặc khuyến nghị khác được cung cấp hoặc xác nhận bởi TradingView. Đọc thêm trong Điều khoản sử dụng.