Disclaimer: This post is purely based on technical chart analysis and is not a recommendation to buy or sell. Please do your own research and consult with a financial advisor before making any investment decisions.
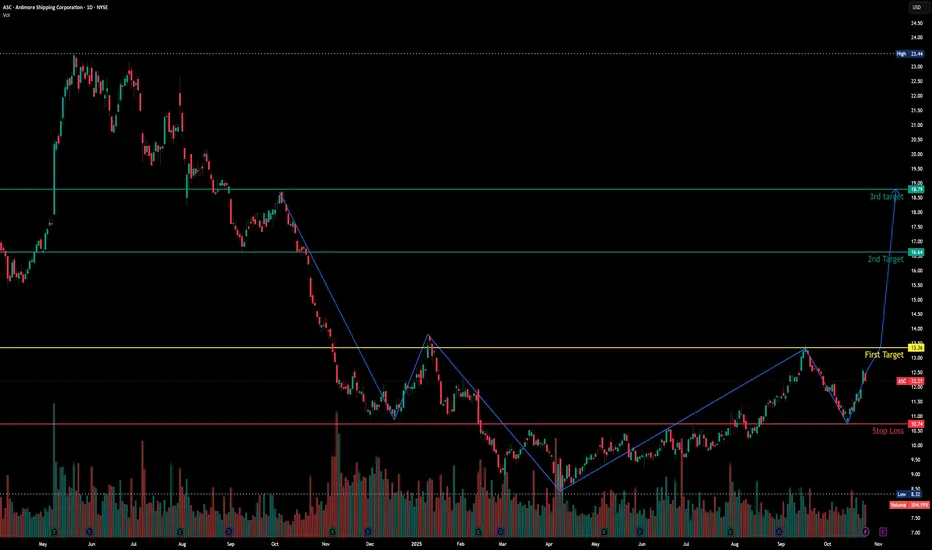
Last Year in May 2024, stock price was at nearly $23. from that level it fall to $8.5.
During this fall and rise, stock has made an inverted Head and Shoulder Chart Pattern.
According to my analysis , i have marked some of levels on the chart for reference.
Please share your thoughts.
Best wishes.
Last Year in May 2024, stock price was at nearly $23. from that level it fall to $8.5.
During this fall and rise, stock has made an inverted Head and Shoulder Chart Pattern.
According to my analysis , i have marked some of levels on the chart for reference.
Please share your thoughts.
Best wishes.
Thông báo miễn trừ trách nhiệm
Thông tin và các ấn phẩm này không nhằm mục đích, và không cấu thành, lời khuyên hoặc khuyến nghị về tài chính, đầu tư, giao dịch hay các loại khác do TradingView cung cấp hoặc xác nhận. Đọc thêm tại Điều khoản Sử dụng.
Thông báo miễn trừ trách nhiệm
Thông tin và các ấn phẩm này không nhằm mục đích, và không cấu thành, lời khuyên hoặc khuyến nghị về tài chính, đầu tư, giao dịch hay các loại khác do TradingView cung cấp hoặc xác nhận. Đọc thêm tại Điều khoản Sử dụng.