Current View
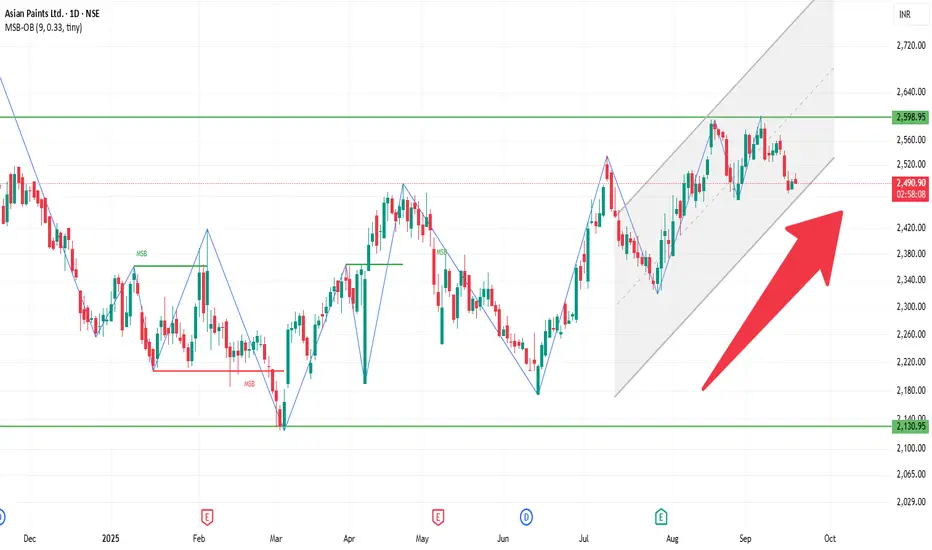
The stock is trading around ₹2,490-₹2,500, roughly in that band.
Recent price action suggests sideways to slightly negative bias in the short term.
The stock is below many of its medium-to-long term moving averages, but above some short term ones — mixed signals.
⚙️ Indicators & Momentum
RSI is in neutral to slightly weak territory (not deeply oversold, not overbought).
MACD shows bearish pressure in recent periods.
Some oscillators & momentum tools showing mild divergence, meaning upward momentum is not strong.
Short-term moving averages are giving mixed signals: some support, some resistance.
📌 Key Levels to Watch
Resistance Zones: ~ ₹2,520-₹2,550 is a resistance range.
Support Zones: ~ ₹2,450-₹2,470 nearer support. More substantial support around ₹2,400-₹2,430.
Bài đăng liên quan
Thông báo miễn trừ trách nhiệm
Thông tin và các ấn phẩm này không nhằm mục đích, và không cấu thành, lời khuyên hoặc khuyến nghị về tài chính, đầu tư, giao dịch hay các loại khác do TradingView cung cấp hoặc xác nhận. Đọc thêm tại Điều khoản Sử dụng.
Thông báo miễn trừ trách nhiệm
Thông tin và các ấn phẩm này không nhằm mục đích, và không cấu thành, lời khuyên hoặc khuyến nghị về tài chính, đầu tư, giao dịch hay các loại khác do TradingView cung cấp hoặc xác nhận. Đọc thêm tại Điều khoản Sử dụng.