Breakout from Ascending Triangle in Aster DM Healthcare
 ASTERDM
📈Pattern & Setup:
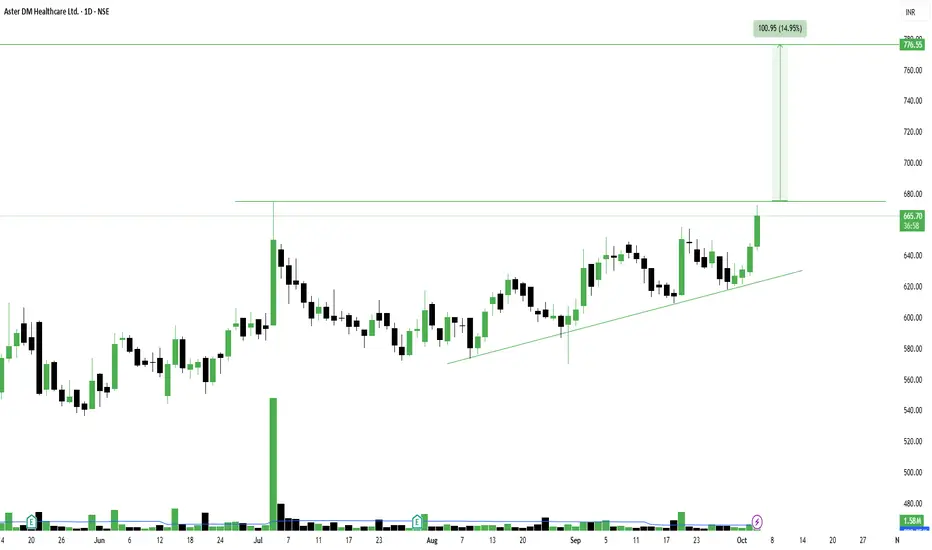
Aster DM Healthcare has given a breakout from an ascending triangle pattern on the daily chart — a strong continuation structure that signals renewed buying interest. The stock has been consolidating tightly between 630–670 zones for several weeks, forming higher lows that highlight bullish pressure building up near resistance.
The breakout candle above 660 is backed by solid volume, confirming strong buyer participation and momentum entry.
📝 Trade Plan:
Entry: Current levels around 665–670 look good for early entry.
🚩Stop-Loss: 635 (below the ascending trendline and recent swing low).
🎯Targets:
Target 1 → 720 (minor resistance zone).
Target 2 → 775 (measured move target, 15% upside).
💡Pyramiding Strategy:
1. Enter first lot around 665–670.
2. Add above 690 if the breakout sustains with volume, trail SL to 650.
3. Add final lot above 720, trail SL to 680.
Ride the trend until it approaches the 770–780 zone.
🧠Logic Behind Selecting this Trade:
The setup is a clean ascending triangle breakout — a classic bullish pattern showing higher lows against a flat resistance. Volume expansion on the breakout day confirms strength, while price structure indicates trend continuation after a healthy consolidation phase. If the stock holds above 660, it can easily push towards 775 in the short term.
Keep Learning. Keep Earning.
Let's grow together 📚🎯
🔴Disclaimer:
This is not an investment advice. Always do your own due diligence before making any trading or investment decision.
📈Pattern & Setup:
Aster DM Healthcare has given a breakout from an ascending triangle pattern on the daily chart — a strong continuation structure that signals renewed buying interest. The stock has been consolidating tightly between 630–670 zones for several weeks, forming higher lows that highlight bullish pressure building up near resistance.
The breakout candle above 660 is backed by solid volume, confirming strong buyer participation and momentum entry.
📝 Trade Plan:
Entry: Current levels around 665–670 look good for early entry.
🚩Stop-Loss: 635 (below the ascending trendline and recent swing low).
🎯Targets:
Target 1 → 720 (minor resistance zone).
Target 2 → 775 (measured move target, 15% upside).
💡Pyramiding Strategy:
1. Enter first lot around 665–670.
2. Add above 690 if the breakout sustains with volume, trail SL to 650.
3. Add final lot above 720, trail SL to 680.
Ride the trend until it approaches the 770–780 zone.
🧠Logic Behind Selecting this Trade:
The setup is a clean ascending triangle breakout — a classic bullish pattern showing higher lows against a flat resistance. Volume expansion on the breakout day confirms strength, while price structure indicates trend continuation after a healthy consolidation phase. If the stock holds above 660, it can easily push towards 775 in the short term.
Keep Learning. Keep Earning.
Let's grow together 📚🎯
🔴Disclaimer:
This is not an investment advice. Always do your own due diligence before making any trading or investment decision.
TrendX INC
Bài đăng liên quan
Thông báo miễn trừ trách nhiệm
Thông tin và các ấn phẩm này không nhằm mục đích, và không cấu thành, lời khuyên hoặc khuyến nghị về tài chính, đầu tư, giao dịch hay các loại khác do TradingView cung cấp hoặc xác nhận. Đọc thêm tại Điều khoản Sử dụng.
TrendX INC
Bài đăng liên quan
Thông báo miễn trừ trách nhiệm
Thông tin và các ấn phẩm này không nhằm mục đích, và không cấu thành, lời khuyên hoặc khuyến nghị về tài chính, đầu tư, giao dịch hay các loại khác do TradingView cung cấp hoặc xác nhận. Đọc thêm tại Điều khoản Sử dụng.