AASTER is ready for ATH vibes again
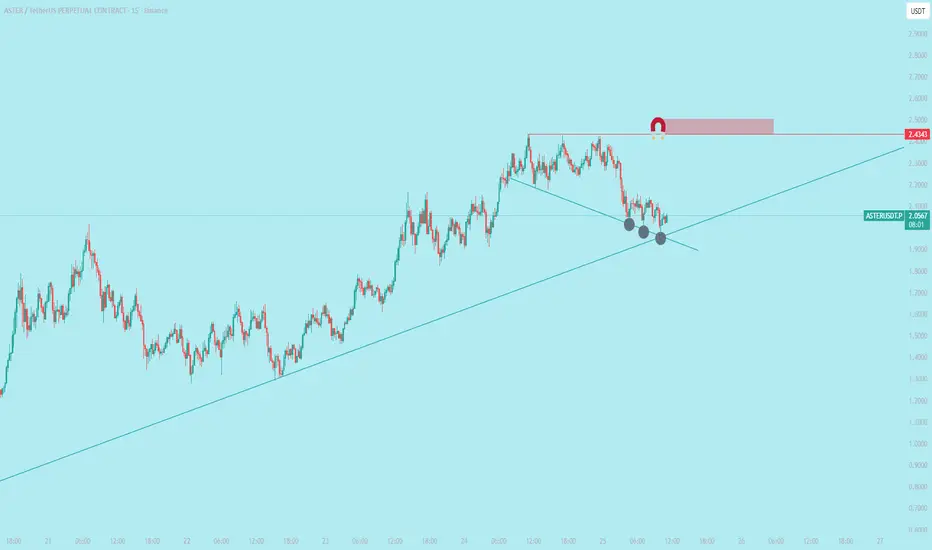
Price Movement: The chart shows a significant uptrend from around $1,000 to a peak near $2,443, followed by a pullback to the current price of $2,049 (as of 10:44 UTC on September 25, 2025). This indicates a recent correction after hitting resistance.
Resistance Level: The horizontal red line at $2,443 acts as a key resistance level where the price struggled to break through, suggesting strong selling pressure at this point.
Support Zone: The intersection of the two trend lines (light blue upward trend and darker blue downward trend) around $2,000-$2,100 marks a potential support zone. The gray circles highlight this area where the price might find buying interest.
Trend Lines: The upward-sloping light blue line reflects the overall uptrend, while the downward-sloping darker blue line indicates a short-term correction or consolidation phase.
Volume and Momentum: While volume data isn't fully visible, the price action suggests momentum has slowed after the resistance test, with a 0.27% change indicating stability at the current level.
Outlook: The price is currently testing the support zone. A bounce from here could signal a retest of $2,443, while a break below $2,000 might lead to further downside toward $1,800-$1,900.
Thông báo miễn trừ trách nhiệm
Thông tin và các ấn phẩm này không nhằm mục đích, và không cấu thành, lời khuyên hoặc khuyến nghị về tài chính, đầu tư, giao dịch hay các loại khác do TradingView cung cấp hoặc xác nhận. Đọc thêm tại Điều khoản Sử dụng.
Thông báo miễn trừ trách nhiệm
Thông tin và các ấn phẩm này không nhằm mục đích, và không cấu thành, lời khuyên hoặc khuyến nghị về tài chính, đầu tư, giao dịch hay các loại khác do TradingView cung cấp hoặc xác nhận. Đọc thêm tại Điều khoản Sử dụng.