ASTRAL LTD; CMP: 1558.50
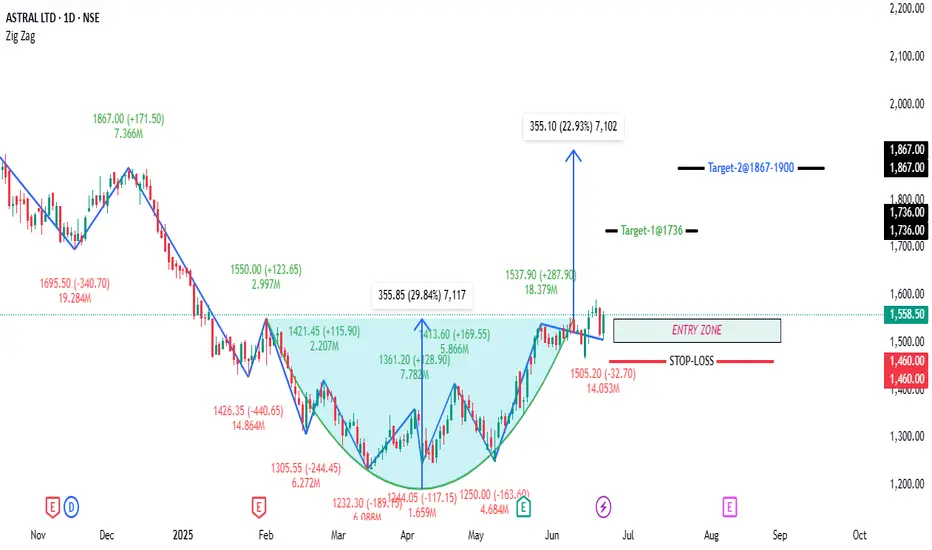
The stock formed a clean rounding bottom from the lows near ₹1230 (Mar 2025) to the breakout above ₹1537.
Breakout occurred with increased volume (18.3M), validating the move.
RSI is at 61.33, indicating momentum is positive but not overbought — favorable for further upside.
The stock has sustained above the breakout zone (~₹1537), which was the neckline and now acts as support.
📈 Long Trade Recommendation
Buy Zone: Current levels around ₹1550–₹1560 (post-breakout pullback and retest looks complete)
Target: ₹1900 (based on height of base: ~355 points from ₹1537 breakout = 1537 + 355)
Stop Loss: ₹1475 (on closing basis) – below recent pullback low and prior support.
Risk-Reward Ratio:4:1 → Strong trade setup.
🔐 Key Support and Resistance Levels
🔼 Resistance Zones:
🔽 Support Zones:
The stock formed a clean rounding bottom from the lows near ₹1230 (Mar 2025) to the breakout above ₹1537.
Breakout occurred with increased volume (18.3M), validating the move.
RSI is at 61.33, indicating momentum is positive but not overbought — favorable for further upside.
The stock has sustained above the breakout zone (~₹1537), which was the neckline and now acts as support.
📈 Long Trade Recommendation
Buy Zone: Current levels around ₹1550–₹1560 (post-breakout pullback and retest looks complete)
Target: ₹1900 (based on height of base: ~355 points from ₹1537 breakout = 1537 + 355)
Stop Loss: ₹1475 (on closing basis) – below recent pullback low and prior support.
Risk-Reward Ratio:4:1 → Strong trade setup.
🔐 Key Support and Resistance Levels
🔼 Resistance Zones:
- ₹1650–₹1695: Intermediate resistance (previous swing high from Dec 2024)
- ₹1735: 1M Pivot Low — may act as resistance due to confluence
- ₹1867: 1W Pivot High
- ₹1900: Target zone and psychological round number
🔽 Support Zones:
- ₹1537: Breakout level (1D Pivot High) — now key support
- ₹1505: Retest level (recent swing low post-breakout)
- ₹1482: 1D Pivot Low
- ₹1475: Stop-loss level — below this structure breaks
- A close below ₹1475 would invalidate the bullish setup.
- Watch for volume follow-through above ₹1600 levels to sustain the move.
- Trailing stop-loss can be adjusted to ₹1537 once price sustains above ₹1650 for multiple sessions
Giao dịch được đóng thủ công
Setup has been invalidated so closing the the thread.However the The chart shows a classic 5-wave Elliott pattern for ASTRAL LTD. The waves are marked in the chart
Interpretation:
• The chart suggests that Wave (V) has completed near the recent peak around 2,500–2,700 levels.
• After the peak of Wave (V), a larger corrective pattern (A-B-C) typically follows, which is consistent with the decline shown in 2025.
• After a full 5-wave impulse, a corrective A-B-C phase often retraces much of the prior advance.
• Common retracement levels:
o 38.2%, 50%, and 61.8% Fibonacci retracement from the low of Wave II to the high of Wave V.
• The price has already corrected to around 1,250–1,400, which is close to the 50% retracement of the move from Wave (II) to Wave (V).
• However full A-B-C pattern is not yet identified with certainty, if the price sustains above 1,200–1,400 and forms a base, a new pull back B phase may take the prices as high at 1850 to 1900. Those who hold the share can wait for another 3-6 months for above targets.
Bài đăng liên quan
Thông báo miễn trừ trách nhiệm
Thông tin và ấn phẩm không có nghĩa là và không cấu thành, tài chính, đầu tư, kinh doanh, hoặc các loại lời khuyên hoặc khuyến nghị khác được cung cấp hoặc xác nhận bởi TradingView. Đọc thêm trong Điều khoản sử dụng.
Bài đăng liên quan
Thông báo miễn trừ trách nhiệm
Thông tin và ấn phẩm không có nghĩa là và không cấu thành, tài chính, đầu tư, kinh doanh, hoặc các loại lời khuyên hoặc khuyến nghị khác được cung cấp hoặc xác nhận bởi TradingView. Đọc thêm trong Điều khoản sử dụng.