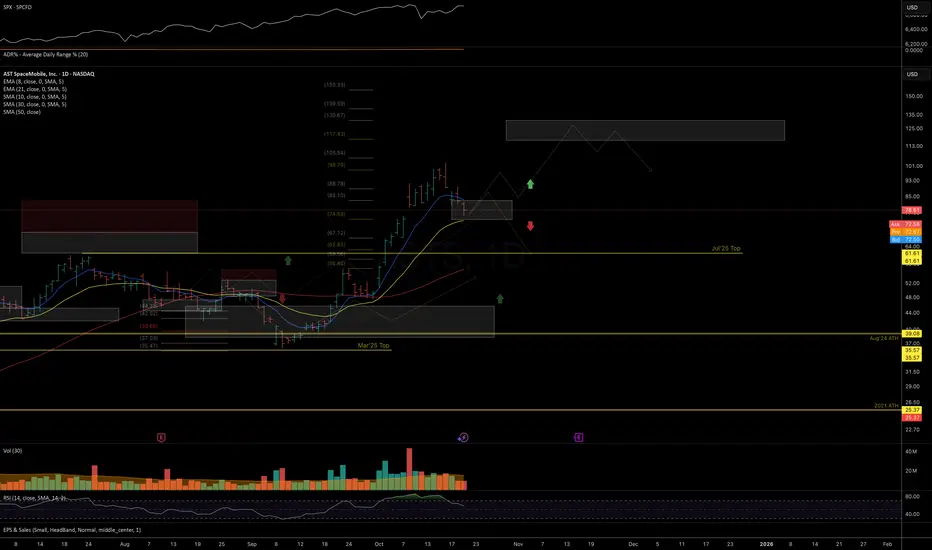
Price has followed through with the upside potential outlined in the September update and has come close to resistance zone (115–130), where at least a mid-term top formation might be expected.
With momentum leaders losing strength recently, price could already be forming the first leg down within a larger degree topping structure. However, as long as price remains above 74 and the 21dEMA, the potential for a direct test of the macro resistance zone cannot be ruled out.
A break below 74 and the 21dEMA would likely confirm the top and increase the odds of a deeper pullback toward July highs and lower levels.
Chart:

Previously:
• On upside potential (Sep 22):
Chart:
https://www.tradingview.com/symbols/NASDAQ-ASTS/minds/?mind=gwLV4UKTSC2aqdPIkUYXDg
• On bottoming action potential (Sep 9):
Chart:
https://www.tradingview.com/symbols/NASDAQ-ASTS/minds/?mind=GLayLldxSCiQAB5cLOO0Cg
• On resistance (Aug 25):
Chart:
https://www.tradingview.com/symbols/NASDAQ-ASTS/minds/?mind=sdIGVez8SiW63op10mPaMg
• On mid-term support (Aug 18):
Chart:
https://www.tradingview.com/symbols/NASDAQ-ASTS/minds/?mind=fIq5oL8RSa2nZapAMgi7xQ
• On bounce setup (Aug 7):
Chart:
https://www.tradingview.com/symbols/NASDAQ-ASTS/minds/?mind=xe5IZbdcQgiRwPezmSua-Q
• On mid-term resistance (Jul 21):
Chart:
https://www.tradingview.com/symbols/NASDAQ-ASTS/minds/?mind=yFfB_9CTT0qPqLGRKQVPpw
With momentum leaders losing strength recently, price could already be forming the first leg down within a larger degree topping structure. However, as long as price remains above 74 and the 21dEMA, the potential for a direct test of the macro resistance zone cannot be ruled out.
A break below 74 and the 21dEMA would likely confirm the top and increase the odds of a deeper pullback toward July highs and lower levels.
Chart:
Previously:
• On upside potential (Sep 22):
Chart:
https://www.tradingview.com/symbols/NASDAQ-ASTS/minds/?mind=gwLV4UKTSC2aqdPIkUYXDg
• On bottoming action potential (Sep 9):
Chart:
https://www.tradingview.com/symbols/NASDAQ-ASTS/minds/?mind=GLayLldxSCiQAB5cLOO0Cg
• On resistance (Aug 25):
Chart:
https://www.tradingview.com/symbols/NASDAQ-ASTS/minds/?mind=sdIGVez8SiW63op10mPaMg
• On mid-term support (Aug 18):
Chart:
https://www.tradingview.com/symbols/NASDAQ-ASTS/minds/?mind=fIq5oL8RSa2nZapAMgi7xQ
• On bounce setup (Aug 7):
Chart:
https://www.tradingview.com/symbols/NASDAQ-ASTS/minds/?mind=xe5IZbdcQgiRwPezmSua-Q
• On mid-term resistance (Jul 21):
Chart:
https://www.tradingview.com/symbols/NASDAQ-ASTS/minds/?mind=yFfB_9CTT0qPqLGRKQVPpw
📊 Daily FREE Market Insights | Crypto + US Stocks
⚡ Technical analysis, setups & commentary
🌍 t.me/MarketArtistryENG | 🇷🇺 t.me/marketartistry
Join and let's grow together! 🚀
⚡ Technical analysis, setups & commentary
🌍 t.me/MarketArtistryENG | 🇷🇺 t.me/marketartistry
Join and let's grow together! 🚀
Thông báo miễn trừ trách nhiệm
Thông tin và ấn phẩm không có nghĩa là và không cấu thành, tài chính, đầu tư, kinh doanh, hoặc các loại lời khuyên hoặc khuyến nghị khác được cung cấp hoặc xác nhận bởi TradingView. Đọc thêm trong Điều khoản sử dụng.