Intraday Support & Resistance (1-Day Level)
MunafaSutra reports:
Short-term Resistance: ₹434.01 and ₹438.97
These levels are cited as valid for intra-day trading scenarios
ICICI Direct shows:
First Support: ₹422.5
Second Support: ₹418.7
Third Support: ₹413.2
Second Resistance: ₹437.2
Third Resistance: ₹441.0
Summary of intraday levels:
Support zone: ~₹422–₹419
Resistance zone: ~₹437–₹441
Current Price Context
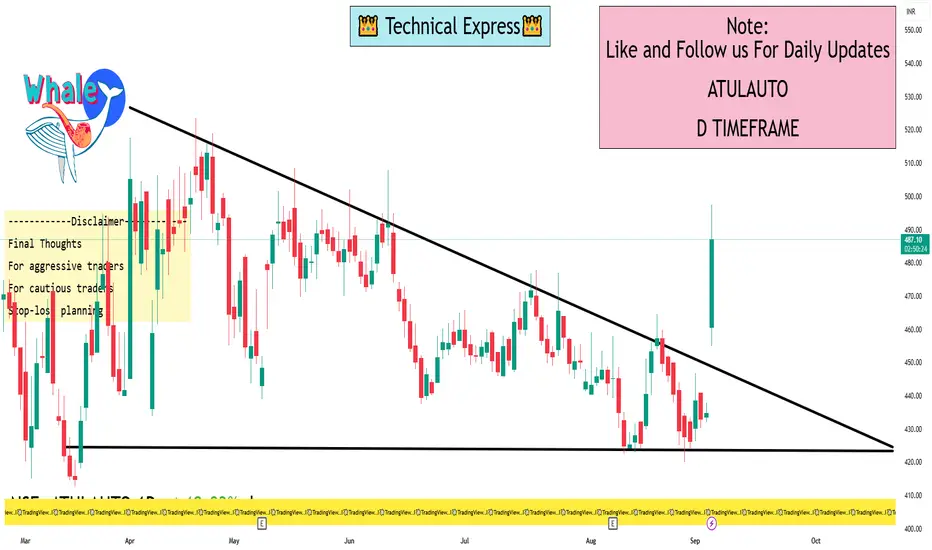
ICICIdirect shows a day high of ₹499.05 and day low of ₹449.00, with a last traded price around ₹490.20 as of September 4, 2025
Investing.com also confirms this high volatility range: day’s range ~₹454.95 to ₹497.60
This suggests the stock has already experienced a significant intraday rally, trading well above the traditional short-term resistance levels noted by analysts.
Technical Ratings (Daily Basis)
TradingView categorizes the 1-day timeframe technical summary for Atul Auto as "Neutral" across both Oscillators and Moving Averages
Final Thoughts
For aggressive traders: A breakout above the ₹495–₹503 zone could spark further upside.
For cautious traders: Watch for potential consolidation and hold above ₹475–₹484 as signs of strength. A dip to ₹434–₹444 still maintains bullish structure for now.
Stop-loss planning: Consider trailing protection below key support levels, e.g., around the pivot zone (₹475) or lower support (₹434).
MunafaSutra reports:
Short-term Resistance: ₹434.01 and ₹438.97
These levels are cited as valid for intra-day trading scenarios
ICICI Direct shows:
First Support: ₹422.5
Second Support: ₹418.7
Third Support: ₹413.2
Second Resistance: ₹437.2
Third Resistance: ₹441.0
Summary of intraday levels:
Support zone: ~₹422–₹419
Resistance zone: ~₹437–₹441
Current Price Context
ICICIdirect shows a day high of ₹499.05 and day low of ₹449.00, with a last traded price around ₹490.20 as of September 4, 2025
Investing.com also confirms this high volatility range: day’s range ~₹454.95 to ₹497.60
This suggests the stock has already experienced a significant intraday rally, trading well above the traditional short-term resistance levels noted by analysts.
Technical Ratings (Daily Basis)
TradingView categorizes the 1-day timeframe technical summary for Atul Auto as "Neutral" across both Oscillators and Moving Averages
Final Thoughts
For aggressive traders: A breakout above the ₹495–₹503 zone could spark further upside.
For cautious traders: Watch for potential consolidation and hold above ₹475–₹484 as signs of strength. A dip to ₹434–₹444 still maintains bullish structure for now.
Stop-loss planning: Consider trailing protection below key support levels, e.g., around the pivot zone (₹475) or lower support (₹434).
I built a Buy & Sell Signal Indicator with 85% accuracy.
📈 Get access via DM or
WhatsApp: wa.link/d997q0
| Email: techncialexpress@gmail.com
| Script Coder | Trader | Investor | From India
📈 Get access via DM or
WhatsApp: wa.link/d997q0
| Email: techncialexpress@gmail.com
| Script Coder | Trader | Investor | From India
Bài đăng liên quan
Thông báo miễn trừ trách nhiệm
Thông tin và ấn phẩm không có nghĩa là và không cấu thành, tài chính, đầu tư, kinh doanh, hoặc các loại lời khuyên hoặc khuyến nghị khác được cung cấp hoặc xác nhận bởi TradingView. Đọc thêm trong Điều khoản sử dụng.