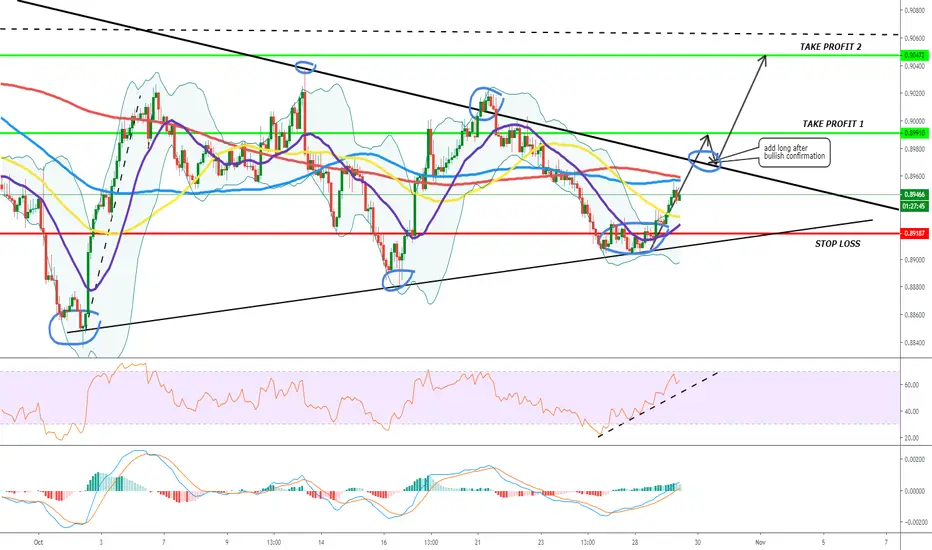
market price confirmed the up trend triangle line and made a higher low that should be followed by a strong up movement which started already yesterday.
Market is still in up trend until he stay above 0,893 area
- MACD baselines are still in up movement and jumped above 0 line and the buy volume seems to getting bigger which is bullish indicator
- RSI baseline is still in up movement and need to close above up trend line for further prce up movement
- Bollinger bands are still in up movement direction which implements further up movement
- 20 day moving average (MA) going to cross the 50 day MA and the 100 day MA the 200 day MA which is bullish indicator
Market need to break the down trend triangle line to activate take profit 2 - we will update this idea in VIP - contact us for further information.
Giao dịch đang hoạt động
Ghi chú
TP1 reachedĐóng lệnh: đạt mục tiêu
The analyses provided are for informational purposes only and do not constitute financial advice or recommendations to buy or sell anything. The information presented is based on personal research and interpretation.
Thông báo miễn trừ trách nhiệm
Thông tin và ấn phẩm không có nghĩa là và không cấu thành, tài chính, đầu tư, kinh doanh, hoặc các loại lời khuyên hoặc khuyến nghị khác được cung cấp hoặc xác nhận bởi TradingView. Đọc thêm trong Điều khoản sử dụng.