AUD/USD 4H – Bearish Symmetrical Triangle Breakdown with Strong Downside Momentum
Detailed Description & Analysis:
Pair: AUD/USD (Australian Dollar vs US Dollar)
Timeframe: 4-hour chart
Key Technical Observations:
Overall Trend:
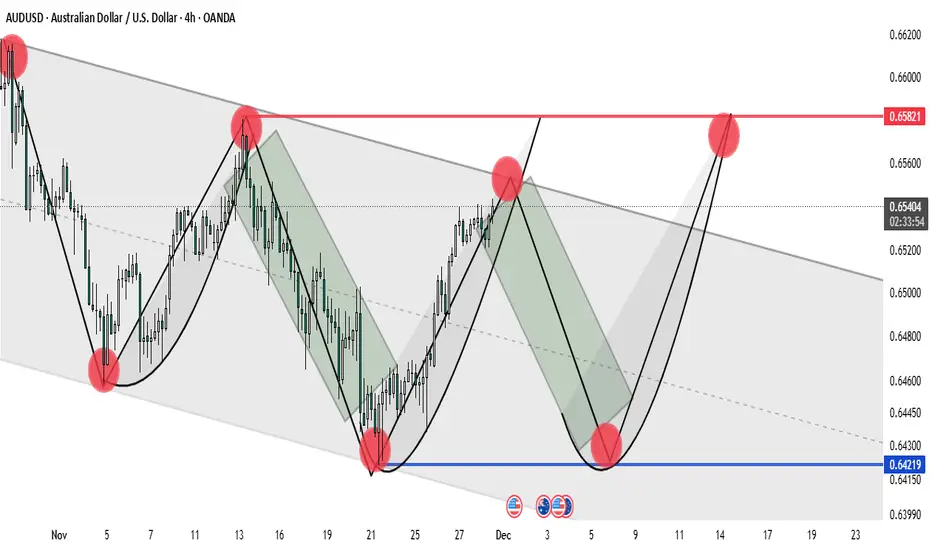
Strongly bearish. The pair has been in a clear downtrend since early November, making lower highs and lower lows.
Pattern:
A large symmetrical triangle (highlighted in green shading) formed between roughly 10–25 November.
Upper trendline: descending resistance connecting the highs around 0.6620 → 0.6582 → 0.6539
Lower trendline: ascending support connecting the swing lows
The triangle acted as a continuation pattern within the broader downtrend.
Breakdown:
Price broke decisively below the lower trendline of the triangle around 25–26 November with a strong bearish candle and increased volume (visible acceleration downward). This confirms the bearish resolution of the pattern.
Current Price Action (as of 28 Nov):
Trading at ~0.6422 (marked in blue) after a sharp drop from the 0.6582–0.6590 area.
Recent 4H candles show almost uninterrupted selling pressure with very little retracement.
Key Levels:
Immediate resistance: Former triangle support (now resistance) around 0.6480–0.6500
Major horizontal resistance: 0.6582 (multiple prior highs)
Next major support: Psychological 0.6400, then 0.6350–0.6330 zone (2023–2024 lows)
Measured Move Target (from triangle):
Height of the triangle at its widest point ≈ 350–400 pips.
Subtracting from the breakdown point (~0.6520) gives a textbook target around 0.6120–0.6170 longer-term.
Momentum & Sentiment:
Extremely bearish. No meaningful bullish divergence or reversal candles yet. Risk of further capitulation toward multi-year lows if 0.6400 gives way.
Detailed Description & Analysis:
Pair: AUD/USD (Australian Dollar vs US Dollar)
Timeframe: 4-hour chart
Key Technical Observations:
Overall Trend:
Strongly bearish. The pair has been in a clear downtrend since early November, making lower highs and lower lows.
Pattern:
A large symmetrical triangle (highlighted in green shading) formed between roughly 10–25 November.
Upper trendline: descending resistance connecting the highs around 0.6620 → 0.6582 → 0.6539
Lower trendline: ascending support connecting the swing lows
The triangle acted as a continuation pattern within the broader downtrend.
Breakdown:
Price broke decisively below the lower trendline of the triangle around 25–26 November with a strong bearish candle and increased volume (visible acceleration downward). This confirms the bearish resolution of the pattern.
Current Price Action (as of 28 Nov):
Trading at ~0.6422 (marked in blue) after a sharp drop from the 0.6582–0.6590 area.
Recent 4H candles show almost uninterrupted selling pressure with very little retracement.
Key Levels:
Immediate resistance: Former triangle support (now resistance) around 0.6480–0.6500
Major horizontal resistance: 0.6582 (multiple prior highs)
Next major support: Psychological 0.6400, then 0.6350–0.6330 zone (2023–2024 lows)
Measured Move Target (from triangle):
Height of the triangle at its widest point ≈ 350–400 pips.
Subtracting from the breakdown point (~0.6520) gives a textbook target around 0.6120–0.6170 longer-term.
Momentum & Sentiment:
Extremely bearish. No meaningful bullish divergence or reversal candles yet. Risk of further capitulation toward multi-year lows if 0.6400 gives way.
Giao dịch đang hoạt động
⚜️Free VIP Signals
t.me/Forexfrontierfx
⚜️Daily Market Mapping
t.me/Forexfrontierfx
⚜️Join My Refferel Broker
one.exnessonelink.com/a/uvd1etcgg1
Refferal Code -
uvd1etcgg1
t.me/Forexfrontierfx
⚜️Daily Market Mapping
t.me/Forexfrontierfx
⚜️Join My Refferel Broker
one.exnessonelink.com/a/uvd1etcgg1
Refferal Code -
uvd1etcgg1
Bài đăng liên quan
Thông báo miễn trừ trách nhiệm
Thông tin và các ấn phẩm này không nhằm mục đích, và không cấu thành, lời khuyên hoặc khuyến nghị về tài chính, đầu tư, giao dịch hay các loại khác do TradingView cung cấp hoặc xác nhận. Đọc thêm tại Điều khoản Sử dụng.