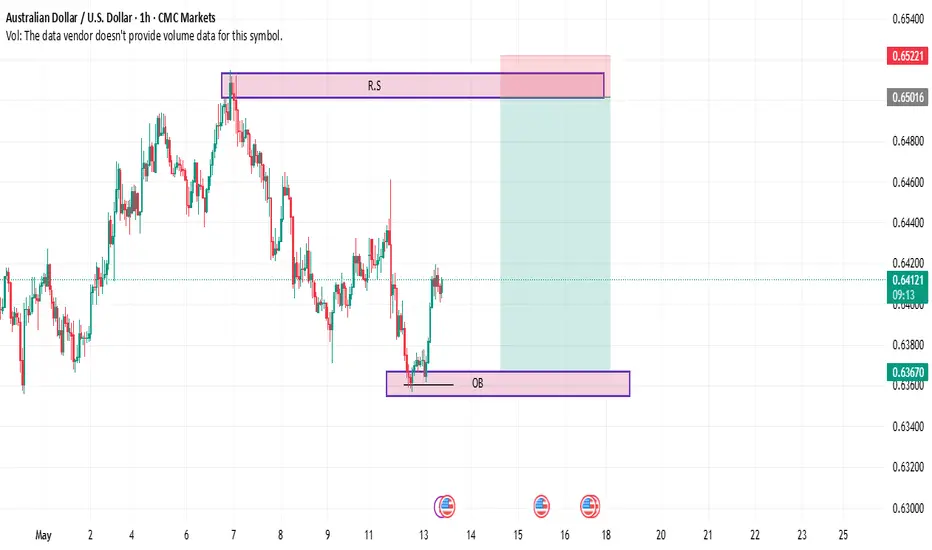
In this 1-hour chart of AUD/USD, we observe a well-defined **Order Block (OB)** at the lower level, acting as a potential demand zone, while a prominent **Resistance/Supply (R.S)** zone appears at the top. The pair recently bounced off the OB area, showing signs of a potential upward move towards the R.S zone. The highlighted green area represents the potential profit zone, while the red zone marks a risk area.
With the recent price action hinting at bullish momentum, traders should watch for reactions around the R.S level to assess whether the trend continues or reverses. Maintaining a balanced risk management strategy is essential in this setup.
With the recent price action hinting at bullish momentum, traders should watch for reactions around the R.S level to assess whether the trend continues or reverses. Maintaining a balanced risk management strategy is essential in this setup.
Thông báo miễn trừ trách nhiệm
Thông tin và ấn phẩm không có nghĩa là và không cấu thành, tài chính, đầu tư, kinh doanh, hoặc các loại lời khuyên hoặc khuyến nghị khác được cung cấp hoặc xác nhận bởi TradingView. Đọc thêm trong Điều khoản sử dụng.
Thông báo miễn trừ trách nhiệm
Thông tin và ấn phẩm không có nghĩa là và không cấu thành, tài chính, đầu tư, kinh doanh, hoặc các loại lời khuyên hoặc khuyến nghị khác được cung cấp hoặc xác nhận bởi TradingView. Đọc thêm trong Điều khoản sử dụng.