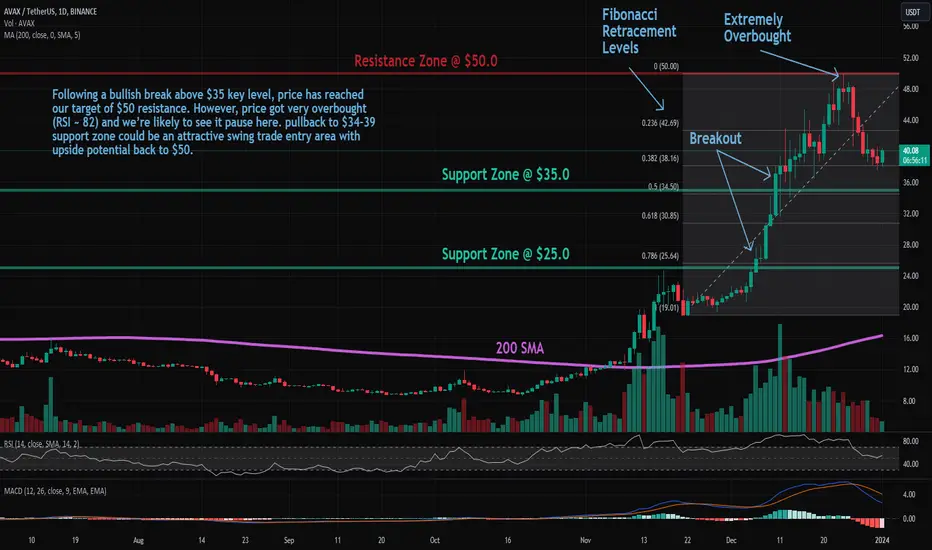
Trade setup: Following a bullish break above $35 key level, price has reached our target of $50 resistance. However, price got very overbought (RSI ~ 82) and we’re seeing some profit taking. Now we wait for the right entry area (support). How far could it pull back? The nearest horizontal support is $35 and the nearest Fibonacci Retracement levels (possible support) are $38 (38.20%), $34 (50%), and $31 (61.80%). Hence, pullback to $34-39 support zone could be an attractive swing trade entry area with upside potential back to $50.
Trend: Uptrend across all time horizons (Short- Medium- and Long-Term).
Momentum is Mixed as MACD Line is below MACD Signal Line (Bearish) but RSI ~ 50 (Neutral).
Support and Resistance: Nearest Support Zone is $35 (previous resistance), then $25. The nearest Resistance Zone is $50.
Trend: Uptrend across all time horizons (Short- Medium- and Long-Term).
Momentum is Mixed as MACD Line is below MACD Signal Line (Bearish) but RSI ~ 50 (Neutral).
Support and Resistance: Nearest Support Zone is $35 (previous resistance), then $25. The nearest Resistance Zone is $50.
Thông báo miễn trừ trách nhiệm
Thông tin và ấn phẩm không có nghĩa là và không cấu thành, tài chính, đầu tư, kinh doanh, hoặc các loại lời khuyên hoặc khuyến nghị khác được cung cấp hoặc xác nhận bởi TradingView. Đọc thêm trong Điều khoản sử dụng.
Thông báo miễn trừ trách nhiệm
Thông tin và ấn phẩm không có nghĩa là và không cấu thành, tài chính, đầu tư, kinh doanh, hoặc các loại lời khuyên hoặc khuyến nghị khác được cung cấp hoặc xác nhận bởi TradingView. Đọc thêm trong Điều khoản sử dụng.