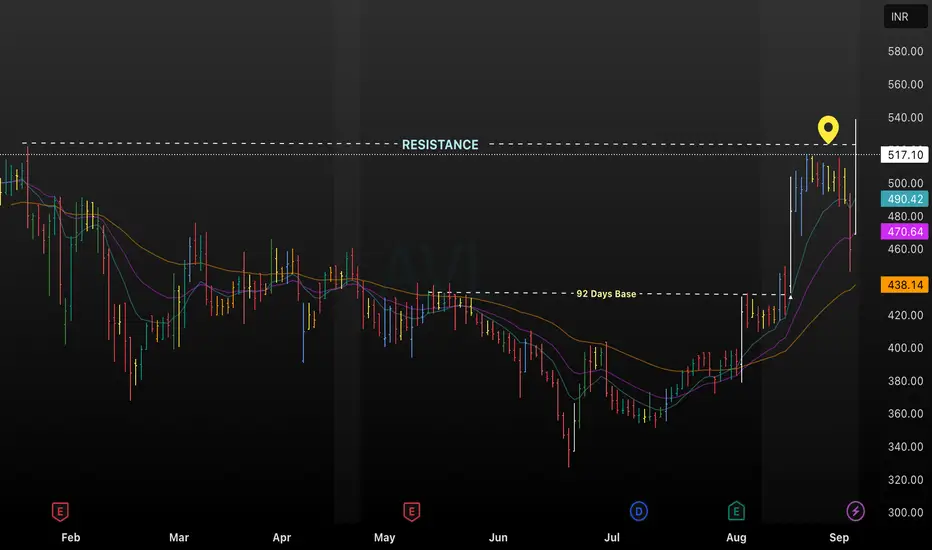
This AVL daily chart highlights a crucial resistance level near ₹540 after a robust 92-day base formation. The recent breakout above this resistance zone signals potential bullish strength, supported by moving averages (EMA 20, 50, 100, 200) currently trending upward above ₹438. A sharp price surge to ₹517 is visible, with strong momentum and historical base support, suggesting possible continuation if resistance sustains.
Use this structure to maximize engagement and provide clarity for community members or followers analyzing AVL’s price action.
Use this structure to maximize engagement and provide clarity for community members or followers analyzing AVL’s price action.
Thông báo miễn trừ trách nhiệm
Thông tin và các ấn phẩm này không nhằm mục đích, và không cấu thành, lời khuyên hoặc khuyến nghị về tài chính, đầu tư, giao dịch hay các loại khác do TradingView cung cấp hoặc xác nhận. Đọc thêm tại Điều khoản Sử dụng.
Thông báo miễn trừ trách nhiệm
Thông tin và các ấn phẩm này không nhằm mục đích, và không cấu thành, lời khuyên hoặc khuyến nghị về tài chính, đầu tư, giao dịch hay các loại khác do TradingView cung cấp hoặc xác nhận. Đọc thêm tại Điều khoản Sử dụng.