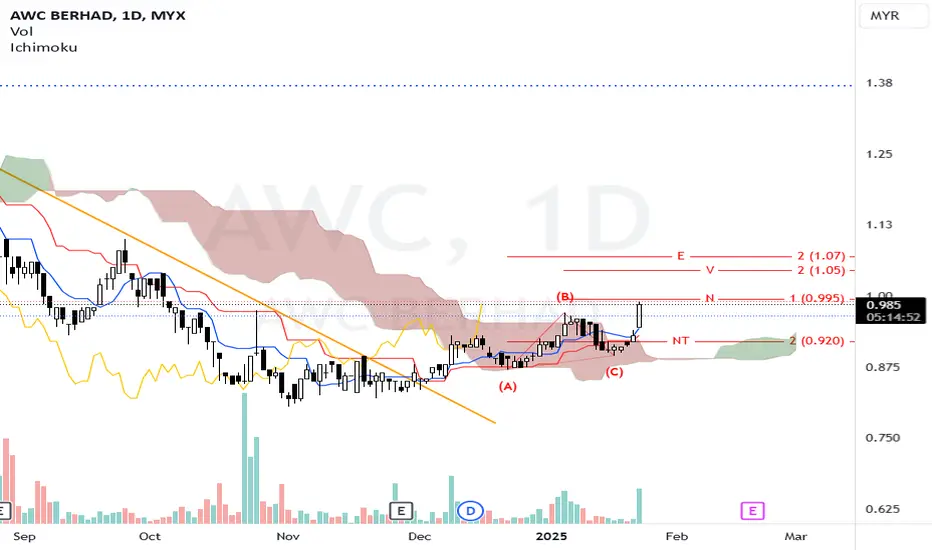
N wave with E, V, N & NT projection.
Price Position: The price is currently above the Kumo, a bullish indicator suggesting positive momentum.
Tenkan-sen is above the Kijun-sen, reinforcing a bullish outlook.
The cloud being green signifies a favorable environment for long positions.
N at 0.995: A near-term resistance target providing insight into trade exits.
NT at 0.920: Serves as a critical support level; a drop below this would signal a shift in market sentiment and potential trend reversal.
Look to enter a long position around the current price of 0.960 or on a confirmed breakout above the N level at 0.995 with significant volume.
Confirmation: Seek bullish candle formations or significant upward movement in volume to validate the buy decision.
Set a stop-loss at 0.910, below the NT support level, to protect against adverse market movements.
Volume Analysis: Pay attention to volume trends, particularly during upward movements. Increased volume will bolster the bullish case.
Market Sentiment: Monitor broader market conditions and news affecting AWC and the construction or engineering sectors.
Risk Management: Adjust position sizes according to risk tolerance and overall market volatility.
Note:
1. Analysis for education purposes only.
2. Trade at your own risk.
Đóng lệnh: đạt mục tiêu
Reached E projectionThông báo miễn trừ trách nhiệm
Thông tin và các ấn phẩm này không nhằm mục đích, và không cấu thành, lời khuyên hoặc khuyến nghị về tài chính, đầu tư, giao dịch hay các loại khác do TradingView cung cấp hoặc xác nhận. Đọc thêm tại Điều khoản Sử dụng.
Thông báo miễn trừ trách nhiệm
Thông tin và các ấn phẩm này không nhằm mục đích, và không cấu thành, lời khuyên hoặc khuyến nghị về tài chính, đầu tư, giao dịch hay các loại khác do TradingView cung cấp hoặc xác nhận. Đọc thêm tại Điều khoản Sử dụng.