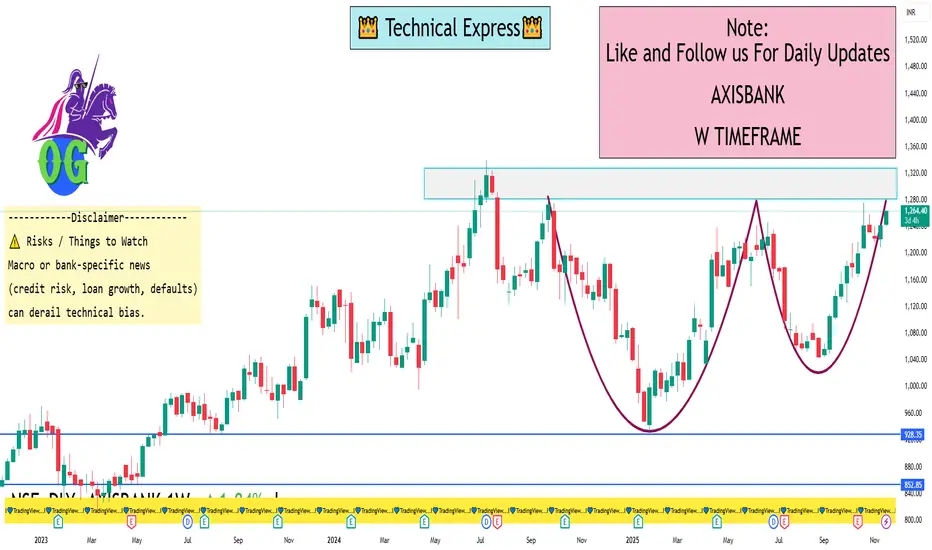
📌 Key Levels & Data
Latest price roughly ₹1,250-₹1,260 per share.
52-week high ~ ₹1,276.10.
52-week low ~ ₹933.50.
Weekly (20-period) moving average ~ ₹1,143.27.
Weekly Bollinger Bands: Upper band ~ ₹1,285.22, Lower band ~ ₹1,001.32.
Weekly Pivot levels (Classic):
Pivot ~ ₹1,232.33
R1 ~ ₹1,255.27, R2 ~ ₹1,268.93, R3 ~ ₹1,291.87
Support S1 ~ ₹1,218.67, S2 ~ ₹1,195.73, S3 ~ ₹1,182.07
⚠️ Risks / Things to Watch
Macro or bank-specific news (credit risk, loan growth, defaults) can derail technical bias.
If weekly candle closes strongly below the 20-week SMA (or lower support), it could invalidate the bullish case.
Volume confirmation: For a strong breakout or pullback, check weekly volume — weak volume may lead to false moves.
I built a Buy & Sell Signal Indicator with 85% accuracy.
📈 Get access via DM or
WhatsApp: wa.link/d997q0
Contact - +91 76782 40962
| Email: techncialexpress@gmail.com
| Script Coder | Trader | Investor | From India
📈 Get access via DM or
WhatsApp: wa.link/d997q0
Contact - +91 76782 40962
| Email: techncialexpress@gmail.com
| Script Coder | Trader | Investor | From India
Bài đăng liên quan
Thông báo miễn trừ trách nhiệm
Thông tin và các ấn phẩm này không nhằm mục đích, và không cấu thành, lời khuyên hoặc khuyến nghị về tài chính, đầu tư, giao dịch hay các loại khác do TradingView cung cấp hoặc xác nhận. Đọc thêm tại Điều khoản Sử dụng.