Educational Article: Understanding the Inverse Head & Shoulder Breakout in Axis Bank.
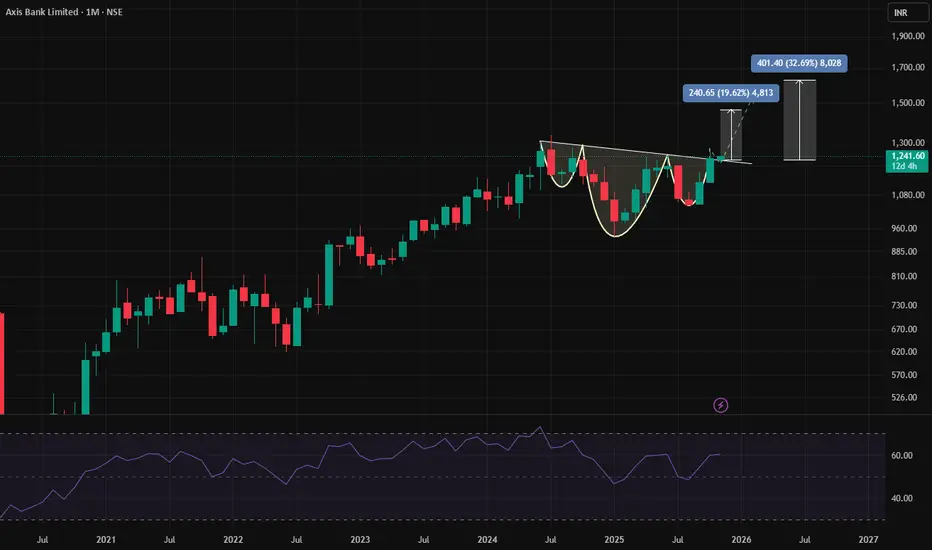
Axis Bank, currently trading around ₹1241 on the monthly charts, is showing a classic inverse head & shoulder breakout at the top of a consolidation zone. This setup, combined with the Relative Strength Index (RSI) trending above 50 and preparing to cross 60, provides a strong technical case for potential upside momentum.
🔍What is an Inverse Head & Shoulder Pattern?
Structure:
Left Shoulder: Initial decline followed by a rebound.
Head: A deeper decline forming the lowest point.
Right Shoulder: A smaller decline, mirroring the left shoulder.
Neckline: The resistance line connecting the peaks of the shoulders.
Breakout Signal: When price breaks above the neckline, it indicates a reversal from bearish to bullish sentiment.
In Axis Bank’s Case:
The pattern has formed after a consolidation phase.
Price is now breaking out of the neckline, suggesting strength and potential continuation upward.
📊 Role of RSI in Confirming Breakouts
The Relative Strength Index (RSI) is a momentum oscillator that measures the speed and change of price movements.
Key Levels:
Above 50 → Indicates bullish momentum.
Crossing 60 → Adds further strength to the uptrend.
Axis Bank’s RSI:
Currently trending above 50.
Preparing to move above 60, which aligns with the breakout, reinforcing the bullish case.
🎯 Learning Points for Traders
Pattern Recognition:
Spotting inverse head & shoulder patterns helps identify potential reversals.
Always confirm with a breakout above the neckline.
Momentum Confirmation:
RSI above 50 signals strength.
A move above 60 during breakout adds conviction to the trade.
Consolidation Context:
Breakouts from consolidation zones often lead to strong directional moves.
Axis Bank’s breakout is happening after a prolonged consolidation, increasing reliability.
Risk Management:
Place stop-loss below the right shoulder or neckline to manage risk.
Avoid chasing the move without confirmation.
📝 Conclusion
The inverse head & shoulder breakout in Axis Bank, supported by RSI strength, presents a textbook example of how price action and momentum indicators work together. For learners, this is a valuable case study in combining chart patterns with RSI confirmation to identify high-probability trading opportunities.
Thông báo miễn trừ trách nhiệm
Thông tin và các ấn phẩm này không nhằm mục đích, và không cấu thành, lời khuyên hoặc khuyến nghị về tài chính, đầu tư, giao dịch hay các loại khác do TradingView cung cấp hoặc xác nhận. Đọc thêm tại Điều khoản Sử dụng.
Thông báo miễn trừ trách nhiệm
Thông tin và các ấn phẩm này không nhằm mục đích, và không cấu thành, lời khuyên hoặc khuyến nghị về tài chính, đầu tư, giao dịch hay các loại khác do TradingView cung cấp hoặc xác nhận. Đọc thêm tại Điều khoản Sử dụng.