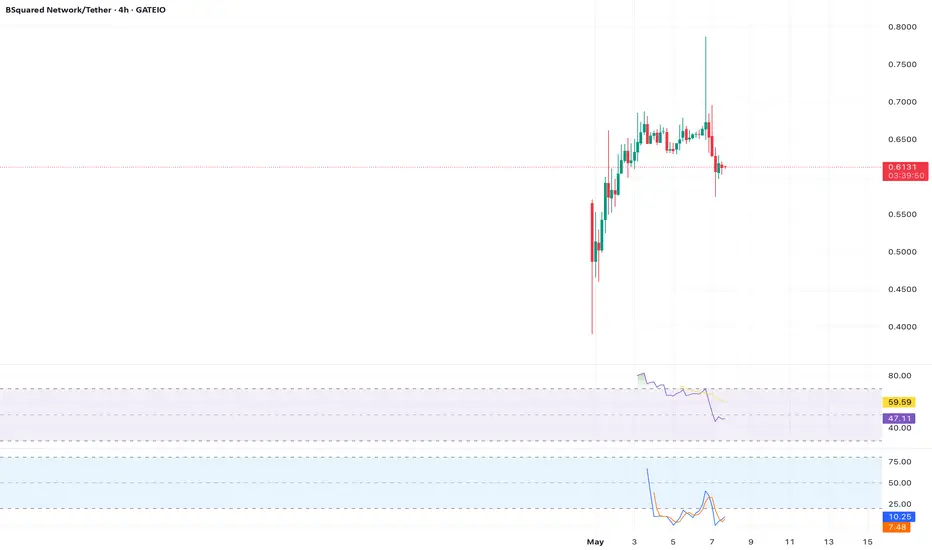
At $0.61, B2 is testing a critical support zone near the 0.618 Fibonacci retracement level, drawn from the all-time low of $0.42 to the recent high of $0.6809. This level has historically acted as a reversal point, supported by a spike in trading volume ($102.8M over 24 hours, up 47.1% from the prior day), signaling strong buying interest. The daily chart shows a bullish divergence on the Stochastic RSI (14, 3, 3), with higher lows in the indicator against lower price lows, hinting at weakening bearish momentum. The price is just below the 20-day Exponential Moving Average (EMA) at $0.615, a key dynamic resistance. A breakout above $0.625 could target $0.6564 (recent high) and $0.68 (all-time high), with the Bollinger Bands’ upper band at $0.67 as a potential ceiling. Conversely, a failure to hold $0.61 may lead to a drop toward $0.5732 or $0.50. Long setups could be considered on a confirmed close above $0.615, with a stop-loss below $0.60. The 30-day price surge of +837.71% reflects strong bullish sentiment, but volatility remains high. Watch for a breakout with volume confirmation before entering trades.
Thông báo miễn trừ trách nhiệm
Thông tin và ấn phẩm không có nghĩa là và không cấu thành, tài chính, đầu tư, kinh doanh, hoặc các loại lời khuyên hoặc khuyến nghị khác được cung cấp hoặc xác nhận bởi TradingView. Đọc thêm trong Điều khoản sử dụng.
Thông báo miễn trừ trách nhiệm
Thông tin và ấn phẩm không có nghĩa là và không cấu thành, tài chính, đầu tư, kinh doanh, hoặc các loại lời khuyên hoặc khuyến nghị khác được cung cấp hoặc xác nhận bởi TradingView. Đọc thêm trong Điều khoản sử dụng.