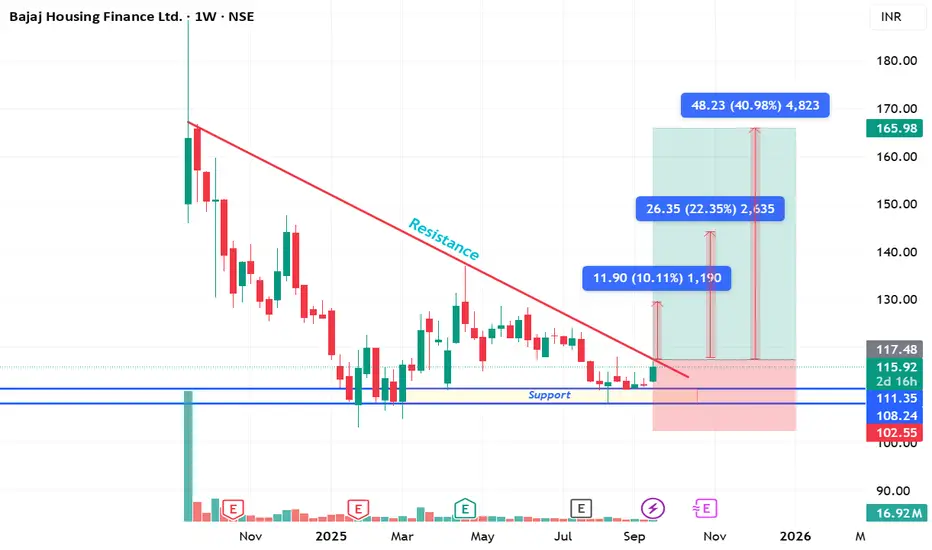
The stock is showing strong price action near the support zone of ₹111–₹108, with multiple rejections confirming demand.
🔹 Key Observations:
Price respecting the support zone (₹111–₹108).
Strong downtrend resistance line tested multiple times.
Breakout above resistance could trigger upside momentum.
🔹 Upside Targets:
🎯 Target 1: ₹127 (≈10% gain)
🎯 Target 2: ₹142 (≈22% gain)
🎯 Target 3: ₹166 (≈41% gain)
🔹 Risk Management:
Stop Loss: ₹102 (below support zone).
Risk-to-Reward looks favorable for positional traders.
⚠️ Note: This is purely for educational purposes, not financial advice. Always do your own research before investing.
#BajajHousingFinance #NSEStocks #SwingTrading #Breakout #TechnicalAnalysis #SupportResistance #IndianStockMarket #TradingView
Thông báo miễn trừ trách nhiệm
Thông tin và các ấn phẩm này không nhằm mục đích, và không cấu thành, lời khuyên hoặc khuyến nghị về tài chính, đầu tư, giao dịch hay các loại khác do TradingView cung cấp hoặc xác nhận. Đọc thêm tại Điều khoản Sử dụng.
Thông báo miễn trừ trách nhiệm
Thông tin và các ấn phẩm này không nhằm mục đích, và không cấu thành, lời khuyên hoặc khuyến nghị về tài chính, đầu tư, giao dịch hay các loại khác do TradingView cung cấp hoặc xác nhận. Đọc thêm tại Điều khoản Sử dụng.