~~Technical Analysis~~
Short-Term (Daily/Intraday):
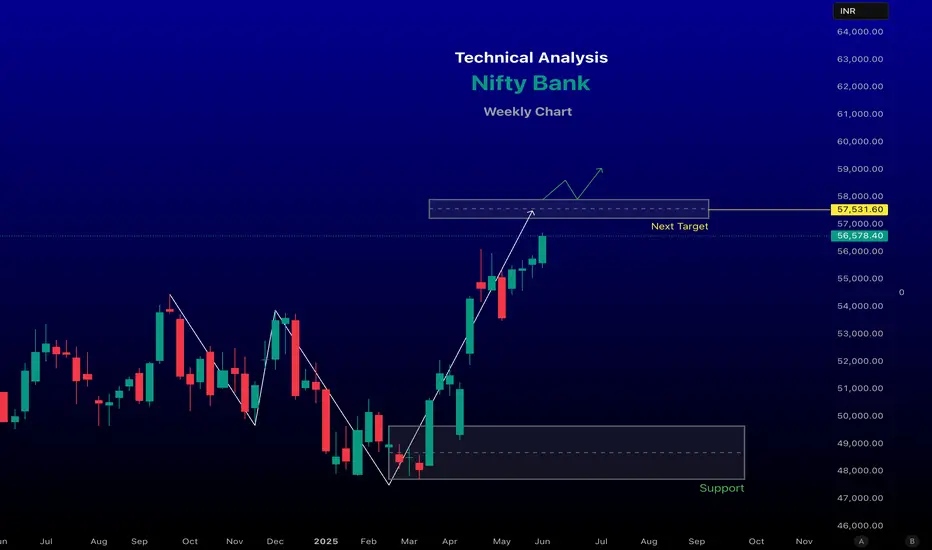
The Bank Nifty is trading within an ascending channel on the 15-minute and daily charts, indicating a bullish structure with potential for further upside.
On June 6, the index oscillated around 56,000 but closed strongly at 56,578.40, supported by positive market breadth (advances/declines ratio of 7:5).
A rising wedge structure on the daily chart (noted on June 4) suggests a potential bearish reversal if the index breaks below key supports, but the recent breakout above 56,200 resistance indicates bullish momentum.
highlight a bullish pattern, with consolidation near resistance levels and a potential MACD crossover signaling further upside.
-- Disclaimer --
This analysis is based on recent technical data and market sentiment from web sources. It is for informational and educational purposes only and not financial advice. Trading involves high risks, and past performance does not guarantee future results. Always conduct your own research or consult a SEBI-registered advisor before trading.
#Boost and comment will be highly appreciated
Short-Term (Daily/Intraday):
The Bank Nifty is trading within an ascending channel on the 15-minute and daily charts, indicating a bullish structure with potential for further upside.
On June 6, the index oscillated around 56,000 but closed strongly at 56,578.40, supported by positive market breadth (advances/declines ratio of 7:5).
A rising wedge structure on the daily chart (noted on June 4) suggests a potential bearish reversal if the index breaks below key supports, but the recent breakout above 56,200 resistance indicates bullish momentum.
highlight a bullish pattern, with consolidation near resistance levels and a potential MACD crossover signaling further upside.
-- Disclaimer --
This analysis is based on recent technical data and market sentiment from web sources. It is for informational and educational purposes only and not financial advice. Trading involves high risks, and past performance does not guarantee future results. Always conduct your own research or consult a SEBI-registered advisor before trading.
#Boost and comment will be highly appreciated
renderwithme
Bài đăng liên quan
Thông báo miễn trừ trách nhiệm
Thông tin và các ấn phẩm này không nhằm mục đích, và không cấu thành, lời khuyên hoặc khuyến nghị về tài chính, đầu tư, giao dịch hay các loại khác do TradingView cung cấp hoặc xác nhận. Đọc thêm tại Điều khoản Sử dụng.
renderwithme
Bài đăng liên quan
Thông báo miễn trừ trách nhiệm
Thông tin và các ấn phẩm này không nhằm mục đích, và không cấu thành, lời khuyên hoặc khuyến nghị về tài chính, đầu tư, giao dịch hay các loại khác do TradingView cung cấp hoặc xác nhận. Đọc thêm tại Điều khoản Sử dụng.