🔎 Higher Timeframe (4H) Outlook
Trend Bias: Clear bearish market structure — price rejected from supply around 54,000–54,100 and printed a strong bearish candle.
Key Supply Zones:
54,400–54,500 (FVG + strong supply)
54,000–54,100 (fresh supply that caused the last drop)
Demand Zone: 53,300–53,450 (green zone marked)
Observation: Price broke short-term bullish corrective channel, resuming bearish trend.
✅ Bias: Bearish on 4H until demand around 53,300–53,450 is tested.
⏱ 1H Chart Structure
Trendline Break: Price broke rising structure and retested supply.
FVG: Fresh bearish Fair Value Gap at 53,800–54,000.
EMA: Acting as dynamic resistance, price closed below.
Support: Immediate support around 53,600–53,650.
⚠️ If support breaks, expect a quick slide to 53,300 zone.
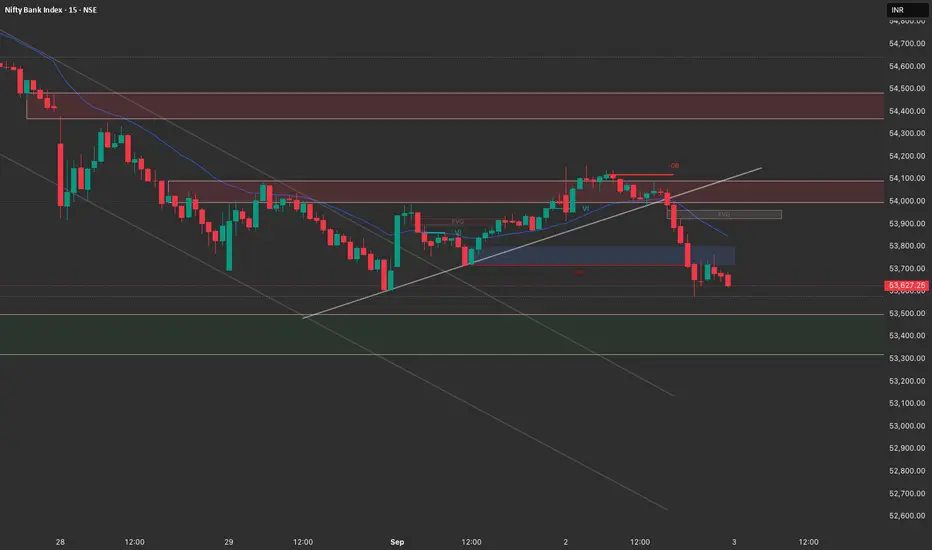
📉 15M Intraday Chart
Break of Structure (BOS): Confirmed at 53,800, marking bearish intent.
Order Blocks:
Bearish OB at 53,950–54,050 (likely short entry zone if retested).
Bullish OB around 53,350–53,400 (possible intraday bounce).
Liquidity: Sell-side liquidity resting below 53,500.
📝 Trade Plan for 3rd September
🔻 Bearish Scenarios
Short on Pullback to Supply
Entry: 53,900–54,000 (FVG zone)
Stop Loss: Above 54,150
Target 1: 53,600
Target 2: 53,350
Breakdown Play
If 53,600 support breaks with momentum, enter short.
SL: Above 53,800
Target: 53,300 demand zone
🔼 Bullish Scenarios (Low Probability)
Only valid if 53,300 demand zone holds with strong rejection.
Intraday bounce possible towards 53,700–53,800, but overall still a sell-on-rise market.
✅ Final Bias
Primary Bias: Bearish → Sell on rise.
Invalidation: If Bank Nifty sustains above 54,100, bearish view is invalidated.
Key Levels to Watch:
Resistance: 53,900–54,100
Support: 53,600 & 53,300–53,350
Trend Bias: Clear bearish market structure — price rejected from supply around 54,000–54,100 and printed a strong bearish candle.
Key Supply Zones:
54,400–54,500 (FVG + strong supply)
54,000–54,100 (fresh supply that caused the last drop)
Demand Zone: 53,300–53,450 (green zone marked)
Observation: Price broke short-term bullish corrective channel, resuming bearish trend.
✅ Bias: Bearish on 4H until demand around 53,300–53,450 is tested.
⏱ 1H Chart Structure
Trendline Break: Price broke rising structure and retested supply.
FVG: Fresh bearish Fair Value Gap at 53,800–54,000.
EMA: Acting as dynamic resistance, price closed below.
Support: Immediate support around 53,600–53,650.
⚠️ If support breaks, expect a quick slide to 53,300 zone.
📉 15M Intraday Chart
Break of Structure (BOS): Confirmed at 53,800, marking bearish intent.
Order Blocks:
Bearish OB at 53,950–54,050 (likely short entry zone if retested).
Bullish OB around 53,350–53,400 (possible intraday bounce).
Liquidity: Sell-side liquidity resting below 53,500.
📝 Trade Plan for 3rd September
🔻 Bearish Scenarios
Short on Pullback to Supply
Entry: 53,900–54,000 (FVG zone)
Stop Loss: Above 54,150
Target 1: 53,600
Target 2: 53,350
Breakdown Play
If 53,600 support breaks with momentum, enter short.
SL: Above 53,800
Target: 53,300 demand zone
🔼 Bullish Scenarios (Low Probability)
Only valid if 53,300 demand zone holds with strong rejection.
Intraday bounce possible towards 53,700–53,800, but overall still a sell-on-rise market.
✅ Final Bias
Primary Bias: Bearish → Sell on rise.
Invalidation: If Bank Nifty sustains above 54,100, bearish view is invalidated.
Key Levels to Watch:
Resistance: 53,900–54,100
Support: 53,600 & 53,300–53,350
Thông báo miễn trừ trách nhiệm
Thông tin và ấn phẩm không có nghĩa là và không cấu thành, tài chính, đầu tư, kinh doanh, hoặc các loại lời khuyên hoặc khuyến nghị khác được cung cấp hoặc xác nhận bởi TradingView. Đọc thêm trong Điều khoản sử dụng.
Thông báo miễn trừ trách nhiệm
Thông tin và ấn phẩm không có nghĩa là và không cấu thành, tài chính, đầu tư, kinh doanh, hoặc các loại lời khuyên hoặc khuyến nghị khác được cung cấp hoặc xác nhận bởi TradingView. Đọc thêm trong Điều khoản sử dụng.