Detailed Market Structure Breakdown
4-Hour Chart (Macro Trend)
Structure: The Bank Nifty is back in a Strong Bullish Momentum phase, recovering from the sharp sell-off last week (Oct 31, where it closed near the lows). The price has successfully climbed back into the steep ascending channel, confirming a strong retest and bounce from the 57,400 area (implied lower channel boundary).
Key Levels:
Major Supply (Resistance): 58,300 - 58,600. This area encompasses the recent swing high and the All-Time High of 58,577.50. A decisive breakout above 58,600 is critical for further upside.
Major Demand (Support): 57,800 - 58,000. This area, which includes the lower trendline of the current ascending channel and a prior FVG, is the must-hold zone for the short-term uptrend.
Outlook: The short-term bias is Strongly Bullish. The market is poised to challenge the ATH again.
1-Hour Chart (Intermediate View)
Structure: The 1H chart shows a clear Break of Structure (MSS) back to the upside, following the successful re-entry into the ascending channel. The price is trading strongly above the 9-period EMA.
Key Levels:
Immediate Resistance: 58,300 (Upper trendline of the immediate channel).
Immediate Support: 57,900 - 58,000 (Psychological mark and lower channel boundary).
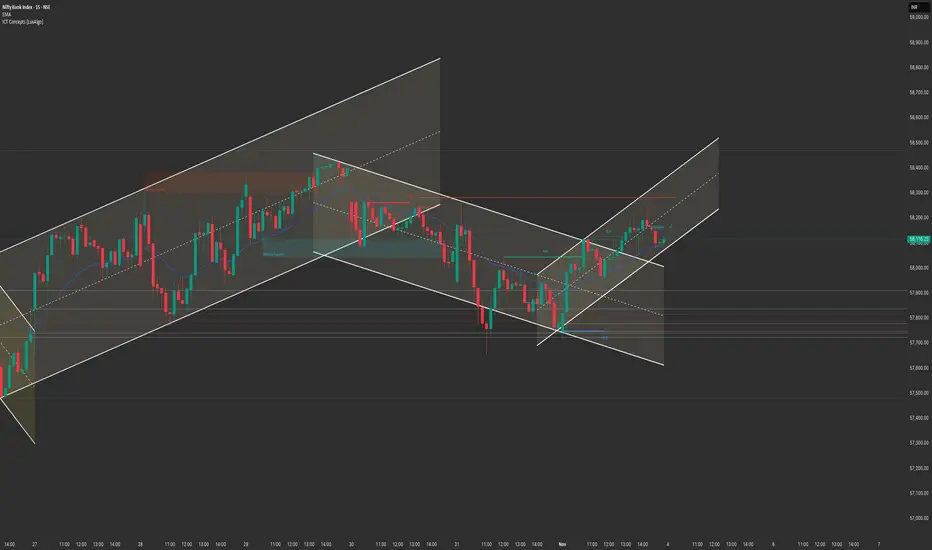
15-Minute Chart (Intraday View)
Structure: The 15M chart confirms the strong reversal. The price is trading at the upper end of the daily range, forming a small bullish continuation pattern right below the 58,300 resistance.
Key Levels:
Intraday Supply: 58,300.
Intraday Demand: 58,000.
Outlook: Aggressively Bullish.
📈 Structure Analysis & Trade Plan: 4th November
Market Outlook: Bank Nifty has shown massive strength, completely negating the sharp selling pressure from last week's end. The focus is on a breakout above the 58,300 resistance for an ATH retest.
Bullish Scenario (Primary Plan: Continuation)
Justification: The successful re-entry into the channel and the V-shaped recovery strongly favor continuation towards the ATH.
Entry: Long entry on a decisive break and 15-minute candle close above 58,300 (breaking the upper channel boundary). Alternatively, look for a dip entry near 58,000 - 58,100 (the immediate support zone).
Stop Loss (SL): Place a stop loss below 57,800 (below the lower channel trendline).
Targets:
T1: 58,577 (All-Time High retest).
T2: 59,000 (Psychological extension target).
Bearish Scenario (Counter-Trend/Reversal)
Justification: High-risk. Only valid if the market fails aggressively at the 58,300 mark.
Trigger: A sustained break and 1-hour close back below 57,800.
Entry: Short entry below 57,800.
Stop Loss (SL): Above 58,100.
Targets:
T1: 57,500 (Previous swing low/consolidation support).
T2: 57,200 (Major FVG support).
Key Levels for Observation:
Immediate Decision Point: 58,000 - 58,300 zone.
Bullish Confirmation: Sustained trade above 58,300.
Bearish Warning: A move below 57,800.
Line in the Sand: 57,800. Below this level, the short-term bullish bias is nullified.
4-Hour Chart (Macro Trend)
Structure: The Bank Nifty is back in a Strong Bullish Momentum phase, recovering from the sharp sell-off last week (Oct 31, where it closed near the lows). The price has successfully climbed back into the steep ascending channel, confirming a strong retest and bounce from the 57,400 area (implied lower channel boundary).
Key Levels:
Major Supply (Resistance): 58,300 - 58,600. This area encompasses the recent swing high and the All-Time High of 58,577.50. A decisive breakout above 58,600 is critical for further upside.
Major Demand (Support): 57,800 - 58,000. This area, which includes the lower trendline of the current ascending channel and a prior FVG, is the must-hold zone for the short-term uptrend.
Outlook: The short-term bias is Strongly Bullish. The market is poised to challenge the ATH again.
1-Hour Chart (Intermediate View)
Structure: The 1H chart shows a clear Break of Structure (MSS) back to the upside, following the successful re-entry into the ascending channel. The price is trading strongly above the 9-period EMA.
Key Levels:
Immediate Resistance: 58,300 (Upper trendline of the immediate channel).
Immediate Support: 57,900 - 58,000 (Psychological mark and lower channel boundary).
15-Minute Chart (Intraday View)
Structure: The 15M chart confirms the strong reversal. The price is trading at the upper end of the daily range, forming a small bullish continuation pattern right below the 58,300 resistance.
Key Levels:
Intraday Supply: 58,300.
Intraday Demand: 58,000.
Outlook: Aggressively Bullish.
📈 Structure Analysis & Trade Plan: 4th November
Market Outlook: Bank Nifty has shown massive strength, completely negating the sharp selling pressure from last week's end. The focus is on a breakout above the 58,300 resistance for an ATH retest.
Bullish Scenario (Primary Plan: Continuation)
Justification: The successful re-entry into the channel and the V-shaped recovery strongly favor continuation towards the ATH.
Entry: Long entry on a decisive break and 15-minute candle close above 58,300 (breaking the upper channel boundary). Alternatively, look for a dip entry near 58,000 - 58,100 (the immediate support zone).
Stop Loss (SL): Place a stop loss below 57,800 (below the lower channel trendline).
Targets:
T1: 58,577 (All-Time High retest).
T2: 59,000 (Psychological extension target).
Bearish Scenario (Counter-Trend/Reversal)
Justification: High-risk. Only valid if the market fails aggressively at the 58,300 mark.
Trigger: A sustained break and 1-hour close back below 57,800.
Entry: Short entry below 57,800.
Stop Loss (SL): Above 58,100.
Targets:
T1: 57,500 (Previous swing low/consolidation support).
T2: 57,200 (Major FVG support).
Key Levels for Observation:
Immediate Decision Point: 58,000 - 58,300 zone.
Bullish Confirmation: Sustained trade above 58,300.
Bearish Warning: A move below 57,800.
Line in the Sand: 57,800. Below this level, the short-term bullish bias is nullified.
Thông báo miễn trừ trách nhiệm
Thông tin và các ấn phẩm này không nhằm mục đích, và không cấu thành, lời khuyên hoặc khuyến nghị về tài chính, đầu tư, giao dịch hay các loại khác do TradingView cung cấp hoặc xác nhận. Đọc thêm tại Điều khoản Sử dụng.
Thông báo miễn trừ trách nhiệm
Thông tin và các ấn phẩm này không nhằm mục đích, và không cấu thành, lời khuyên hoặc khuyến nghị về tài chính, đầu tư, giao dịch hay các loại khác do TradingView cung cấp hoặc xác nhận. Đọc thêm tại Điều khoản Sử dụng.