📊 Daily Support and Resistance Levels
Immediate Support: ₹1,204.27
Short-Term Support: ₹1,188.23
Key Resistance: ₹1,245.83
Short-Term Resistance: ₹1,233.07
🔁 Pivot Points (Daily)
Central Pivot Point (CPR): ₹1,217.03
Resistance Levels: ₹1,245.83, ₹1,261.87
Support Levels: ₹1,175.47, ₹1,188.23
📈 Technical Indicators
Relative Strength Index (RSI): Currently, the RSI is between 45 and 55, indicating a neutral market condition.
Moving Averages: The stock is trading near its short-term moving averages, suggesting a consolidation phase.
Volume: Moderate trading volume observed, indicating steady investor interest.
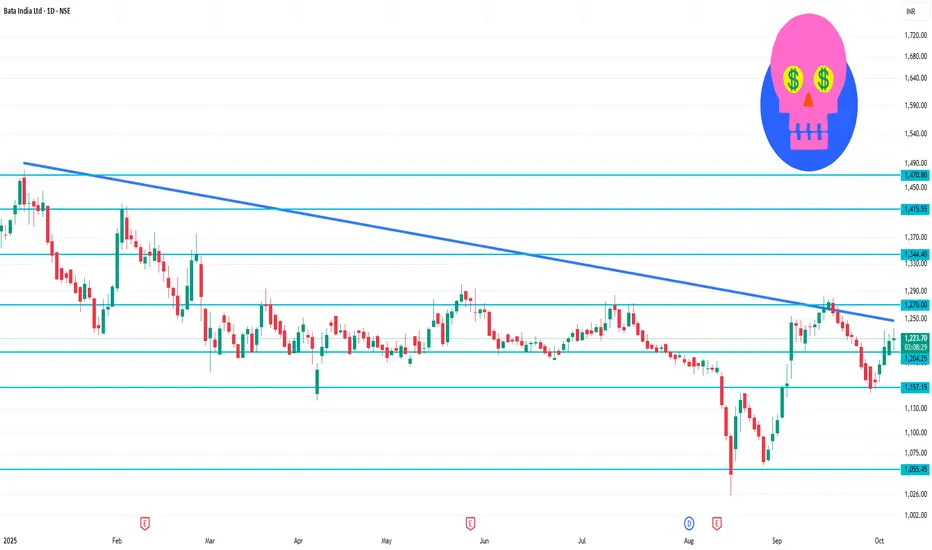
✅ Trade Insights
Bata India Ltd is currently in a neutral trend on the daily chart. A breakout above ₹1,245.83 could signal a bullish move towards ₹1,261.87. Conversely, a drop below ₹1,204.27 may indicate further downside.
Immediate Support: ₹1,204.27
Short-Term Support: ₹1,188.23
Key Resistance: ₹1,245.83
Short-Term Resistance: ₹1,233.07
🔁 Pivot Points (Daily)
Central Pivot Point (CPR): ₹1,217.03
Resistance Levels: ₹1,245.83, ₹1,261.87
Support Levels: ₹1,175.47, ₹1,188.23
📈 Technical Indicators
Relative Strength Index (RSI): Currently, the RSI is between 45 and 55, indicating a neutral market condition.
Moving Averages: The stock is trading near its short-term moving averages, suggesting a consolidation phase.
Volume: Moderate trading volume observed, indicating steady investor interest.
✅ Trade Insights
Bata India Ltd is currently in a neutral trend on the daily chart. A breakout above ₹1,245.83 could signal a bullish move towards ₹1,261.87. Conversely, a drop below ₹1,204.27 may indicate further downside.
Bài đăng liên quan
Thông báo miễn trừ trách nhiệm
Thông tin và ấn phẩm không có nghĩa là và không cấu thành, tài chính, đầu tư, kinh doanh, hoặc các loại lời khuyên hoặc khuyến nghị khác được cung cấp hoặc xác nhận bởi TradingView. Đọc thêm trong Điều khoản sử dụng.
Bài đăng liên quan
Thông báo miễn trừ trách nhiệm
Thông tin và ấn phẩm không có nghĩa là và không cấu thành, tài chính, đầu tư, kinh doanh, hoặc các loại lời khuyên hoặc khuyến nghị khác được cung cấp hoặc xác nhận bởi TradingView. Đọc thêm trong Điều khoản sử dụng.