Hello, fellow traders.
Follow us to get the latest information quickly.
Have a great day.
-------------------------------------
(BCHUSDT 1M Chart)
If the price holds above 473.4, it is expected to attempt to rise above 678.7.
-
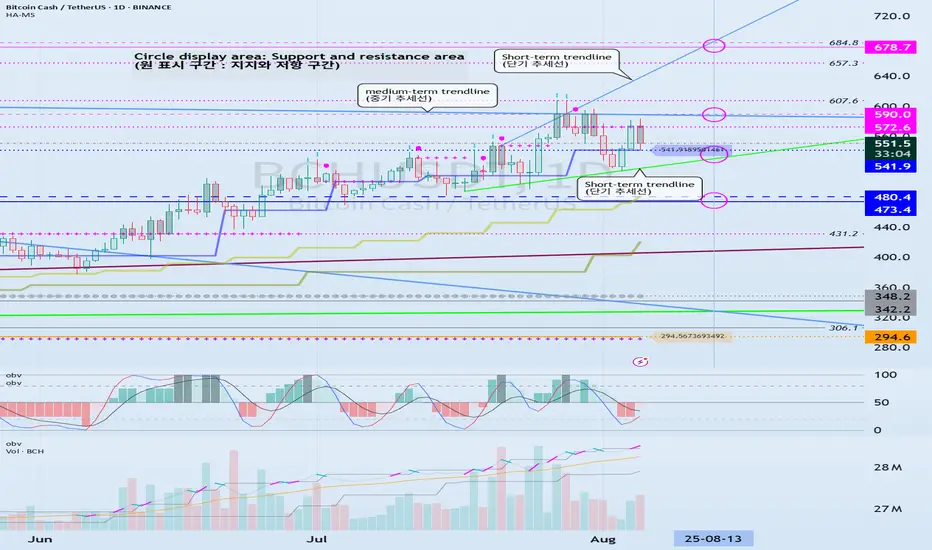
(1D chart)
The key is whether the price can find support in the 541.9-572.6 range and rise above 590.0.
If it falls below 541.9, we need to check for support near 473.4.
The upward trend is expected to continue only if it breaks above the intermediate-term trend line.
-
Thank you for reading.
I wish you successful trading.
--------------------------------------------------
- This is an explanation of the big picture.
(3-year bull market, 1-year bear market pattern)

I will explain in more detail when the bear market begins.
------------------------------------------------------
※ Follow X to check out the posts.
※ X를 팔로우하고 게시물을 확인하세요.
◆ t.me/readCryptoChannel
[HA-MS Indicator]
bit.ly/3YxHgvN
[OBV Indicator]
bit.ly/4dcyny3
※ X를 팔로우하고 게시물을 확인하세요.
◆ t.me/readCryptoChannel
[HA-MS Indicator]
bit.ly/3YxHgvN
[OBV Indicator]
bit.ly/4dcyny3
Bài đăng liên quan
Thông báo miễn trừ trách nhiệm
Thông tin và ấn phẩm không có nghĩa là và không cấu thành, tài chính, đầu tư, kinh doanh, hoặc các loại lời khuyên hoặc khuyến nghị khác được cung cấp hoặc xác nhận bởi TradingView. Đọc thêm trong Điều khoản sử dụng.