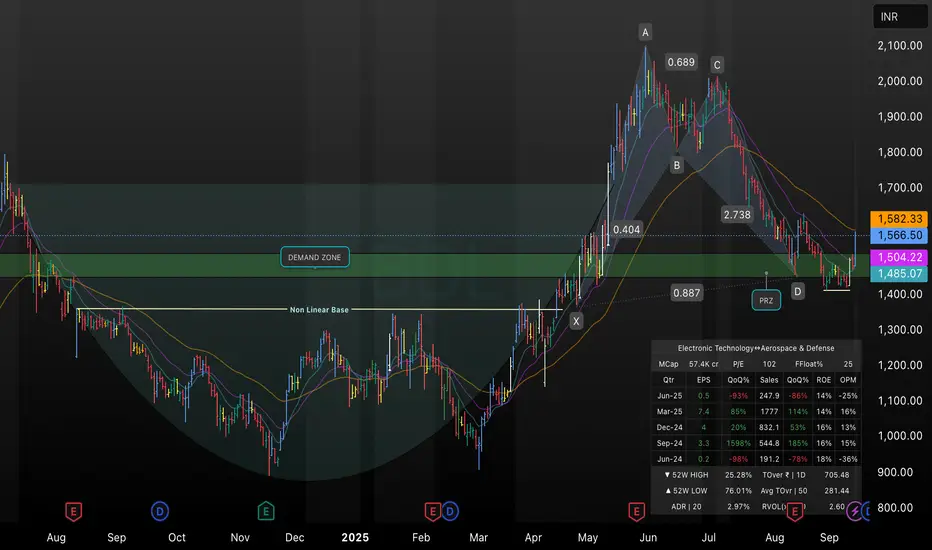
This daily chart of BDL highlights a completed bullish harmonic pattern converging with a strong demand zone between ₹1,480–₹1,510. The recent reversal from the Potential Reversal Zone (PRZ) and the overlap with the nonlinear base signal accumulation, while the confluence of 21/50 EMA suggests short-term support. Key resistance lies near ₹1,580; a break above may extend the upmove, while failure to hold ₹1,485 could invalidate the bullish setup. This chart is intended for educational and technical analysis purposes only.
Thông báo miễn trừ trách nhiệm
Thông tin và ấn phẩm không có nghĩa là và không cấu thành, tài chính, đầu tư, kinh doanh, hoặc các loại lời khuyên hoặc khuyến nghị khác được cung cấp hoặc xác nhận bởi TradingView. Đọc thêm trong Điều khoản sử dụng.
Thông báo miễn trừ trách nhiệm
Thông tin và ấn phẩm không có nghĩa là và không cấu thành, tài chính, đầu tư, kinh doanh, hoặc các loại lời khuyên hoặc khuyến nghị khác được cung cấp hoặc xác nhận bởi TradingView. Đọc thêm trong Điều khoản sử dụng.