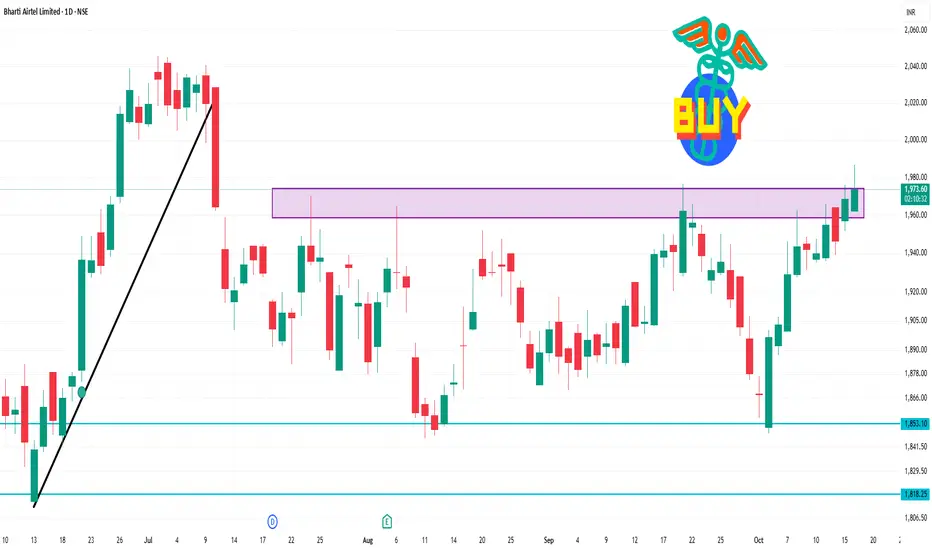
Bharti Airtel Limited is trading at ₹1,973.50, reflecting a 0.31% increase from the previous close.
Technical Analysis Overview (1-Day Time Frame):
Trend: Neutral to mildly bullish
Support Levels: ₹1,900 – ₹1,895
Resistance Levels: ₹1,920 – ₹1,925 and ₹1,950 – ₹1,960
Key Technical Indicators:
Moving Averages: All major moving averages (20-day, 50-day, 200-day) are bullish, indicating upward momentum.
Relative Strength Index (RSI): At 55.9, suggesting a neutral stance, neither overbought nor oversold.
Commodity Channel Index (CCI): At -214.32, indicating a bullish condition.
Momentum Oscillator: Positive, reinforcing the bullish outlook.
Average Directional Index (ADX): At 20.28, suggesting a neutral trend strength.
Bài đăng liên quan
Thông báo miễn trừ trách nhiệm
Thông tin và các ấn phẩm này không nhằm mục đích, và không cấu thành, lời khuyên hoặc khuyến nghị về tài chính, đầu tư, giao dịch hay các loại khác do TradingView cung cấp hoặc xác nhận. Đọc thêm tại Điều khoản Sử dụng.
Bài đăng liên quan
Thông báo miễn trừ trách nhiệm
Thông tin và các ấn phẩm này không nhằm mục đích, và không cấu thành, lời khuyên hoặc khuyến nghị về tài chính, đầu tư, giao dịch hay các loại khác do TradingView cung cấp hoặc xác nhận. Đọc thêm tại Điều khoản Sử dụng.