Editorial Insights
- Symmetrical triangles signal a balanced tug-of-war between buyers and sellers; this compression, as mapped here, often precedes significant expansions in volume and volatility.
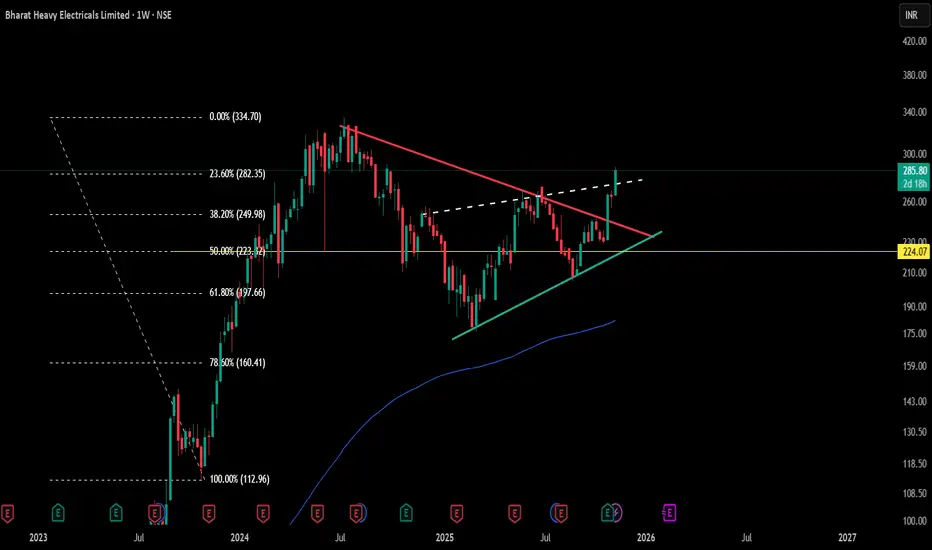
- The triangular structure’s edges—CT (red) and trendline (green)—have been tested repeatedly over months, reflecting both supply absorption and demand resilience.
- The hidden white line adds a subtle layer of convergence, useful for traders identifying areas of potential liquidity concentration.
- The yellow 50% Fibonacci level frames the equilibrium for this market phase, offering a snapshot of price discovery dynamics within the triangle.
- Price positioning relative to all these lines is best seen as a way to monitor evolving order flow and market intent, without any explicit forecasting or directional bias.
Key Levels & Reference
- CT (Red): Major supply test points.
- Trendline (Green): Demand and higher low sequence.
- Hidden Line (White): Structural convergence not visibly obvious but influential.
- Fibonacci 50% (Yellow): Core equilibrium reflecting price agreement zone.
This post is for educational and analytical purposes, respecting the principle that all information is a visual observation—not a prediction or directional signal, but a live structure map to enrich your pattern playbook.
- Symmetrical triangles signal a balanced tug-of-war between buyers and sellers; this compression, as mapped here, often precedes significant expansions in volume and volatility.
- The triangular structure’s edges—CT (red) and trendline (green)—have been tested repeatedly over months, reflecting both supply absorption and demand resilience.
- The hidden white line adds a subtle layer of convergence, useful for traders identifying areas of potential liquidity concentration.
- The yellow 50% Fibonacci level frames the equilibrium for this market phase, offering a snapshot of price discovery dynamics within the triangle.
- Price positioning relative to all these lines is best seen as a way to monitor evolving order flow and market intent, without any explicit forecasting or directional bias.
Key Levels & Reference
- CT (Red): Major supply test points.
- Trendline (Green): Demand and higher low sequence.
- Hidden Line (White): Structural convergence not visibly obvious but influential.
- Fibonacci 50% (Yellow): Core equilibrium reflecting price agreement zone.
This post is for educational and analytical purposes, respecting the principle that all information is a visual observation—not a prediction or directional signal, but a live structure map to enrich your pattern playbook.
🎯 Master My Self-Made Trading Strategy
📈 Telegram (Learn Today): t.me/hashtaghammer
✅ WhatsApp (Learn Today): wa.me/919455664601
📈 Telegram (Learn Today): t.me/hashtaghammer
✅ WhatsApp (Learn Today): wa.me/919455664601
Bài đăng liên quan
Thông báo miễn trừ trách nhiệm
Thông tin và các ấn phẩm này không nhằm mục đích, và không cấu thành, lời khuyên hoặc khuyến nghị về tài chính, đầu tư, giao dịch hay các loại khác do TradingView cung cấp hoặc xác nhận. Đọc thêm tại Điều khoản Sử dụng.