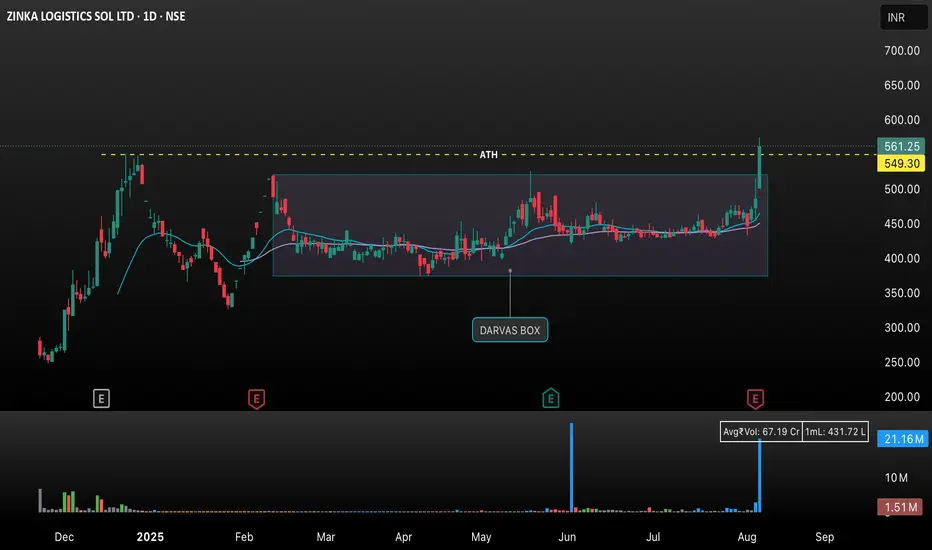
This chart shows the daily price action of Zinka Logistics Sol Ltd (NSE) with a focus on recent technical developments:
• Darvas Box Pattern: For several months, the stock price traded sideways within a well-marked “Darvas Box” range, approximately between ₹400 and ₹549.30. This represents a consolidation phase where the stock found both support and resistance within this zone.
• All-Time High Resistance: The yellow dashed line at ₹549.30 marks the previous all-time high (ATH) level, acting as a critical resistance point.
• Breakout and Volume Surge: On the latest trading day, the stock price sharply broke above the ATH resistance, closing at ₹561.25—a gain of 15.66%. This move was supported by a significant spike in trading volume, as shown at the bottom of the chart, which reinforces the breakout’s strength.
• Bullish Signal: Such a breakout from a long consolidation within a Darvas Box, particularly on elevated volume, is typically interpreted by traders as a strong bullish signal, suggesting the start of an upward trend.
• Indicators: The chart also includes a moving average line (light blue) that underscores recent momentum and trend direction.
Thông báo miễn trừ trách nhiệm
Thông tin và ấn phẩm không có nghĩa là và không cấu thành, tài chính, đầu tư, kinh doanh, hoặc các loại lời khuyên hoặc khuyến nghị khác được cung cấp hoặc xác nhận bởi TradingView. Đọc thêm trong Điều khoản sử dụng.
Thông báo miễn trừ trách nhiệm
Thông tin và ấn phẩm không có nghĩa là và không cấu thành, tài chính, đầu tư, kinh doanh, hoặc các loại lời khuyên hoặc khuyến nghị khác được cung cấp hoặc xác nhận bởi TradingView. Đọc thêm trong Điều khoản sử dụng.