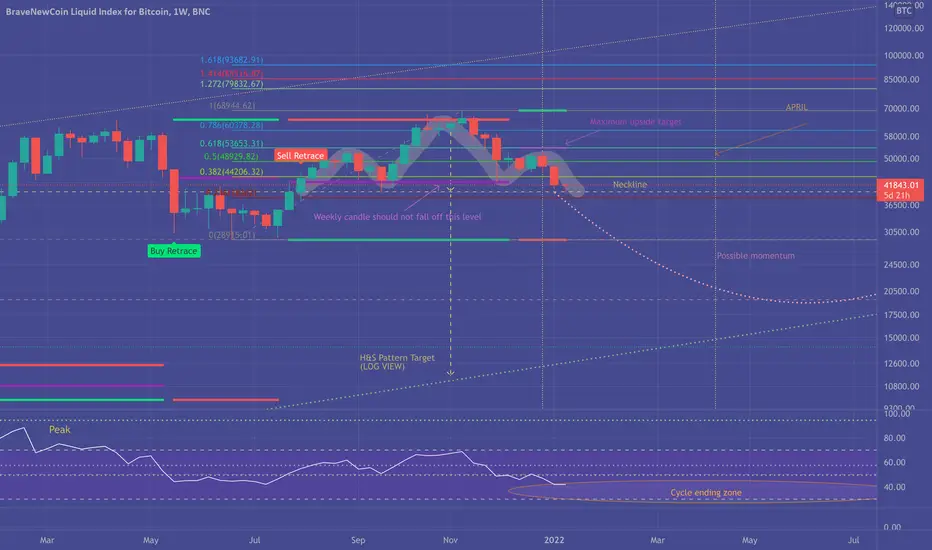
#BTC , feel "OK" only when the weekly candle not fall off 42500
IMHO+Architectural & design aesthetic point of view ,
upside of BTC this year could be maximum 53500 (purple line)
(look difficult already, 44000 should be height of this week candle)
Whenever weekly candle confirm to be under the lower purple line 42500
it will go 28800.
.
I don't want to write anything that make u goes panic mode..
(but i dont wanna underestimate the weekly bearish divergence as well)
I "MUST" say that from all of my previous analysis of Alt coins that I predicted
for "accumulation" phase it could turn "distribution" phase instead
(means no more pamping, Whales sell - small fish collects and when market crashes = small fish die
whales will come back that time so try to survive :)))
.
Nobody knows what's really happening. The prediction is the prediction.
Stay cautious and do the good money/risk management
.
.
(Skip reading further to stay a bit more optimistic)
.
.
.
.
.
.
.
if SP500 crashes (Or any crisis happens), BTC will even go lower to 12480
That time monthly RSI should enter the cycle ending zone = Oversold level = End of the cycle
Only that we will start the new cycle of Crypto that BTC should go to 85000-100000
3rd peak already gone.
.
Peace,
feel free to comment/ feedback
Mil
Ghi chú

Ghi chú
One logic that supports "accumulation phase" = Whales are in Asiaand it always green Asian time = Collecting
Ghi chú
I'd be very happy if this prediction gone wrong :PGhi chú
Ghi chú
Why it gets stuck? because this resistance is quite strong 
Bài đăng liên quan
Thông báo miễn trừ trách nhiệm
Thông tin và ấn phẩm không có nghĩa là và không cấu thành, tài chính, đầu tư, kinh doanh, hoặc các loại lời khuyên hoặc khuyến nghị khác được cung cấp hoặc xác nhận bởi TradingView. Đọc thêm trong Điều khoản sử dụng.
Bài đăng liên quan
Thông báo miễn trừ trách nhiệm
Thông tin và ấn phẩm không có nghĩa là và không cấu thành, tài chính, đầu tư, kinh doanh, hoặc các loại lời khuyên hoặc khuyến nghị khác được cung cấp hoặc xác nhận bởi TradingView. Đọc thêm trong Điều khoản sử dụng.