BNB/USDT Weekly Chart Update
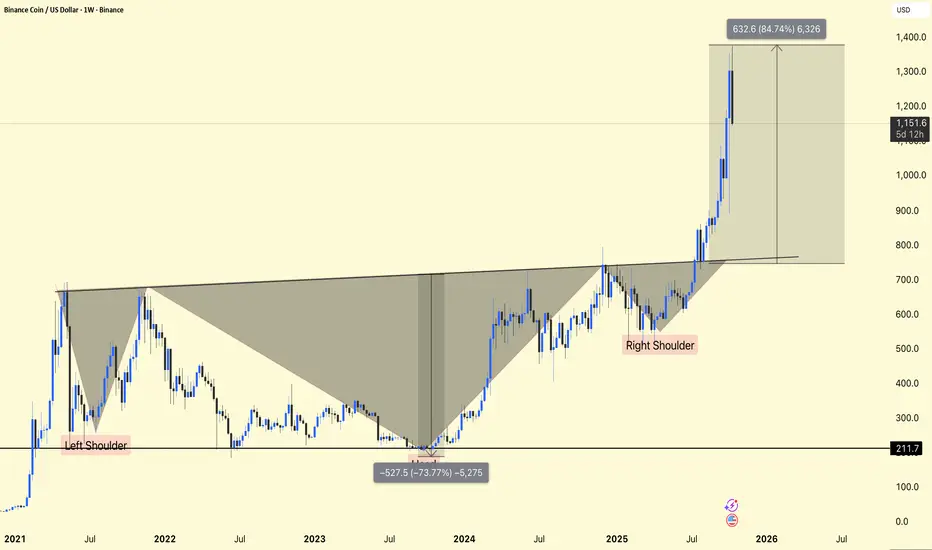
BNB has completed a massive inverse head and shoulders pattern on the weekly timeframe – a strong bullish reversal structure that confirms the long-term uptrend.
After breaking the $750 neckline, the price quickly rose to $1,230+, representing a gain of approximately +85% from the breakout zone. Current price activity remains strong, but a short-term decline towards $1,000-$1,100 would be good for continued downside.
Support: $800-$850 (neckline retest zone)
Short-term support: $1,000-$1,100
Target area: $1,350-$1,400
The breakout structure is bullish and intact – declines can be viewed as accumulation opportunities for the next leg up.
DYOR | NFA
Bài đăng liên quan
Thông báo miễn trừ trách nhiệm
Thông tin và các ấn phẩm này không nhằm mục đích, và không cấu thành, lời khuyên hoặc khuyến nghị về tài chính, đầu tư, giao dịch hay các loại khác do TradingView cung cấp hoặc xác nhận. Đọc thêm tại Điều khoản Sử dụng.
Bài đăng liên quan
Thông báo miễn trừ trách nhiệm
Thông tin và các ấn phẩm này không nhằm mục đích, và không cấu thành, lời khuyên hoặc khuyến nghị về tài chính, đầu tư, giao dịch hay các loại khác do TradingView cung cấp hoặc xác nhận. Đọc thêm tại Điều khoản Sử dụng.