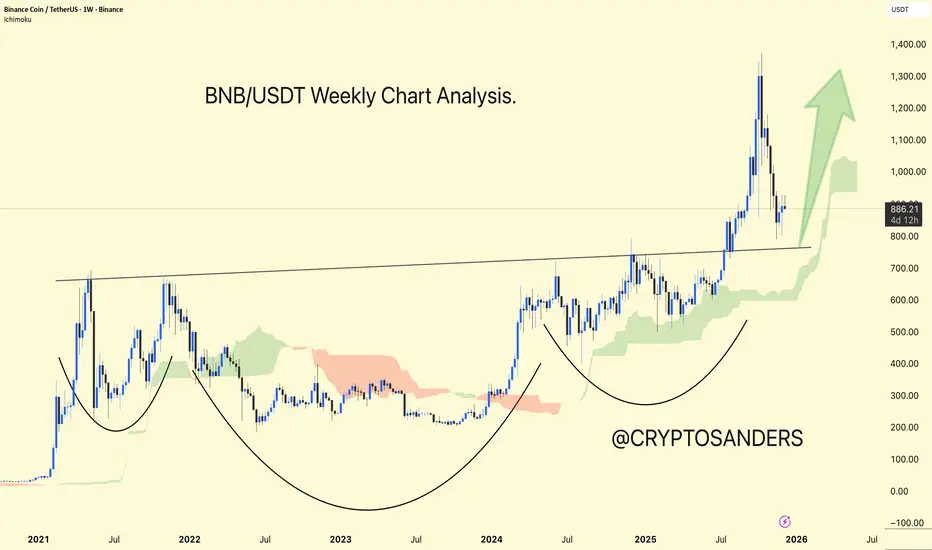
BNB/USDT is trading in the range of 800 to 900 and remains within a larger bullish structure, but on higher timeframes, the price is still below a significant resistance band in the 1,160–1,180 zone.
Recent technical analysis indicates that BNB is trading above its key moving averages, with most indicators in "buy" territory, confirming the ongoing uptrend. However, some readings are approaching overbought levels.
On the chart, significant resistance is shown near 1,160–1,180 (the upper wedge boundary), while support is initially found around 1,095–1,100 and then at 1,050–1,020 if the wedge base is broken.
DYOR | NFA,
Bài đăng liên quan
Thông báo miễn trừ trách nhiệm
Thông tin và các ấn phẩm này không nhằm mục đích, và không cấu thành, lời khuyên hoặc khuyến nghị về tài chính, đầu tư, giao dịch hay các loại khác do TradingView cung cấp hoặc xác nhận. Đọc thêm tại Điều khoản Sử dụng.
Bài đăng liên quan
Thông báo miễn trừ trách nhiệm
Thông tin và các ấn phẩm này không nhằm mục đích, và không cấu thành, lời khuyên hoặc khuyến nghị về tài chính, đầu tư, giao dịch hay các loại khác do TradingView cung cấp hoặc xác nhận. Đọc thêm tại Điều khoản Sử dụng.