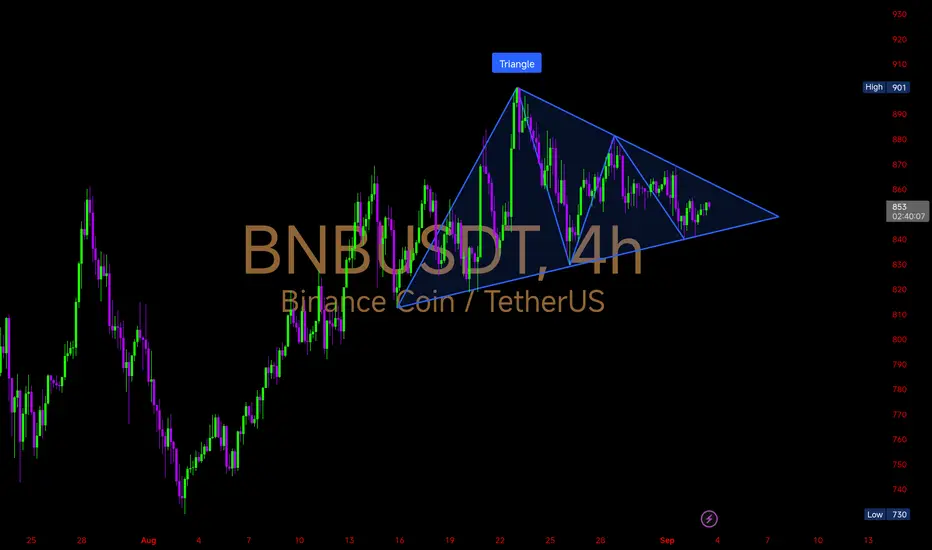
Price is consolidating inside a symmetrical triangle after the strong rally toward $901. This pattern signals a big breakout move ahead.
Key Levels
Upside Breakout Zone: $865 → $880 → $900
Downside Support Zone: $845 → $830 → $800
🔹A breakout above $865 could ignite momentum towards $900+, confirming trend continuation.
🔸 If price falls below $845, we may see a correction toward $820–800 before any recovery.
#BNB is coiling tighter. Expect volatility soon — whichever side breaks first will set the direction.
Thông báo miễn trừ trách nhiệm
Thông tin và ấn phẩm không có nghĩa là và không cấu thành, tài chính, đầu tư, kinh doanh, hoặc các loại lời khuyên hoặc khuyến nghị khác được cung cấp hoặc xác nhận bởi TradingView. Đọc thêm trong Điều khoản sử dụng.
Thông báo miễn trừ trách nhiệm
Thông tin và ấn phẩm không có nghĩa là và không cấu thành, tài chính, đầu tư, kinh doanh, hoặc các loại lời khuyên hoặc khuyến nghị khác được cung cấp hoặc xác nhận bởi TradingView. Đọc thêm trong Điều khoản sử dụng.