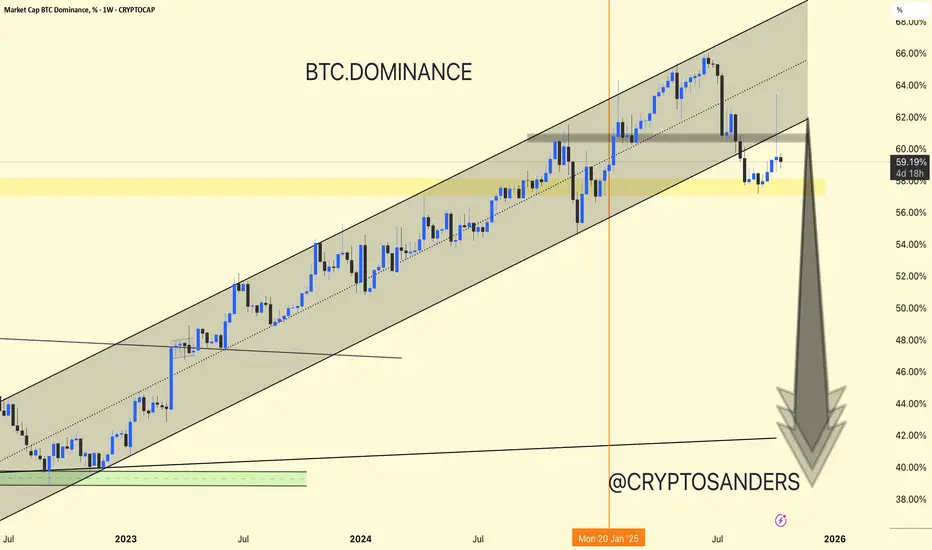
Chart Overview (BTC.D – Weekly Timeframe)
Current Level: ~59.24%
Trend: BTC dominance is still moving within a long-term ascending channel, but recently retested the lower boundary after encountering resistance around 64-65%.
Retest of Rising Channel Support:
BTC dominance touched the lower trendline of the ascending channel and found short-term support near the 58% area (marked in yellow).
Resistance Area (60-62%)
The chart shows a gray resistance area where dominance was previously rejected. This area is crucial for confirmation.
If BTC.D does not close above this, we could see further downside movement.
Potential Downside Ahead:
The large downward arrow indicates a potential correction phase, targeting the 50-45% dominance levels – a scenario that typically benefits altcoins (altseason signal).
Support Zone: 56-58%
Resistance Zone: 60-62%
Potential Downside Target: Around 45%
Trend Structure: Still bullish in the long term, but bearish momentum is possible in the short term.
If BTC dominance decreases, it means altcoins could strengthen.
If BTC dominance increases again, Bitcoin will continue to outperform altcoins.
BTC dominance is strengthening after a long bullish run.
If it fails to reach 60-62%, a trend toward altcoins is expected in the coming weeks.
DYOR | NFA
Bài đăng liên quan
Thông báo miễn trừ trách nhiệm
Thông tin và các ấn phẩm này không nhằm mục đích, và không cấu thành, lời khuyên hoặc khuyến nghị về tài chính, đầu tư, giao dịch hay các loại khác do TradingView cung cấp hoặc xác nhận. Đọc thêm tại Điều khoản Sử dụng.
Bài đăng liên quan
Thông báo miễn trừ trách nhiệm
Thông tin và các ấn phẩm này không nhằm mục đích, và không cấu thành, lời khuyên hoặc khuyến nghị về tài chính, đầu tư, giao dịch hay các loại khác do TradingView cung cấp hoặc xác nhận. Đọc thêm tại Điều khoản Sử dụng.