Hello
It's a Bitcoinguide.
If you have a "follower"
You can receive comment notifications on real-time travel routes and major sections.
If my analysis is helpful,
I would like one booster button at the bottom, please.
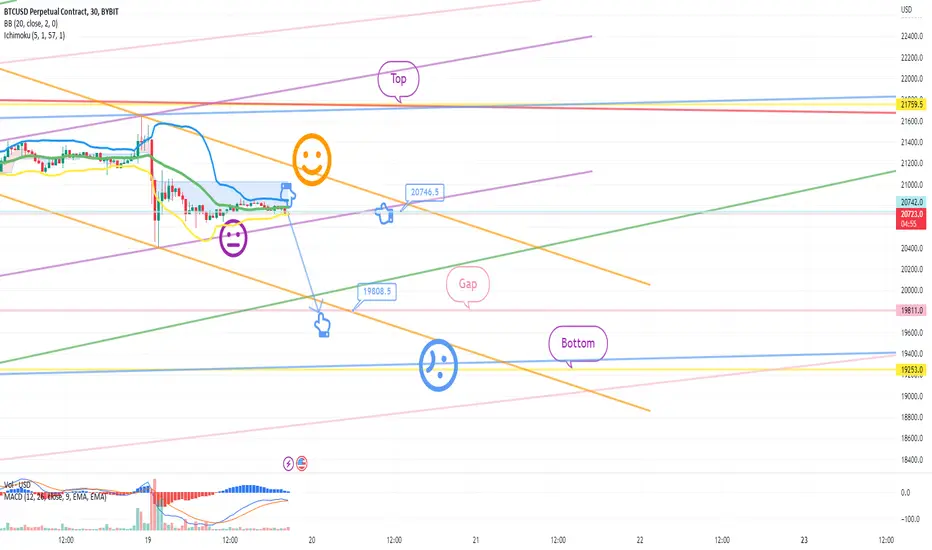
Bitcoin 30 minute chart.
It is a one-way short position strategy.
To be precise, it is a short -> long switching strategy.
Light blue finger movement path
1. $20729.5 short position entry section / stop loss when orange resistance line completely breaks through
2. Long position switching at 19808.5 USD / stop loss when breaking the light blue support line
The long position target is $20746.5.
My analysis is for reference only, please.
I hope you operate safely with principle trading / stop loss essential
thank you.
Giao dịch đang hoạt động
hello
It's a Bitcoinuide.
This is the movement after writing the Bitcoin analysis article.
The major sections were marked with a black finger.
Extremely transverse finish without large waves
by wave
There was no breakout of the orange resistance line.
While walking sideways, pushing to the right
because there is no movement
This strategy is also active processing.
Let's look at it as a whole.
I'll see you in a minute.
thank you.
*비트코인가이드 공식텔레그램 Telegram
t.me/BTG_Group
*빙엑스 BingX 50%DC+$5,000 (총1회수수료)
bingx.com/invite/YBM3A4
*바이비트 Bybit 20%DC+$5,020
partner.bybit.com/b/Bitcoin_Guide
*앞으로는 하단의 네이버카페에서만 활동합니다.
cafe.naver.com/loanlife82
t.me/BTG_Group
*빙엑스 BingX 50%DC+$5,000 (총1회수수료)
bingx.com/invite/YBM3A4
*바이비트 Bybit 20%DC+$5,020
partner.bybit.com/b/Bitcoin_Guide
*앞으로는 하단의 네이버카페에서만 활동합니다.
cafe.naver.com/loanlife82
Bài đăng liên quan
Thông báo miễn trừ trách nhiệm
The information and publications are not meant to be, and do not constitute, financial, investment, trading, or other types of advice or recommendations supplied or endorsed by TradingView. Read more in the Terms of Use.