Hello
It's a Bitcoin Guide.
If you "follow"
You can receive real-time movement paths and comment notifications on major sections.
If my analysis was helpful,
Please click the booster button at the bottom.

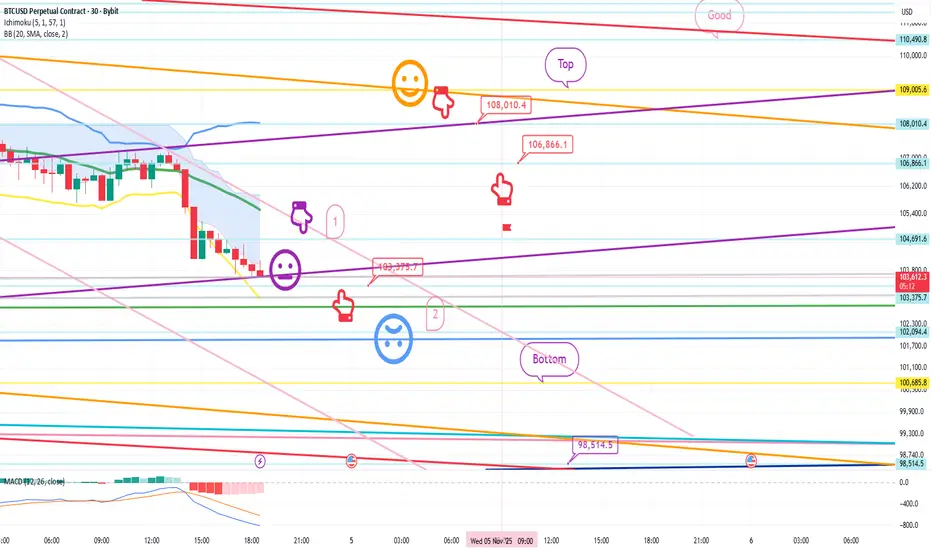
This is the Bitcoin 30-minute chart.
The Nasdaq indicators will be released shortly at noon.
Due to the end of Daylight Savings Time, we need to move back an hour from the previous chart.
Based on the pattern, the weekly chart reached the Bollinger Band support line,
which is a major support line.
However,
there's also pressure from the MACD dead cross on the monthly chart,
and the possibility of a Nasdaq coupling appears high during a decline.
So,
I developed today's strategy centered on the Nasdaq's lower gap retracement.
*When the red finger moves,
this is a conditional long position strategy.
1. Confirm that the purple finger touches the first section (autonomous short).
$103,375.7 long position entry point / stop loss if the light blue support line is broken.
2. $108,010.4 long position primary target -> Target prices are set at Top, then Good in that order. If the strategy is successful, 106.8K will be the point where you can re-enter a long position.
If the price falls immediately without touching the first point at the top, then the second point is the final long position.
The second point is a double bottom based on the low of this uptrend.
Based on the lower tail, the price is open from the bottom to 98.5K.
It would be wise to prepare for a failure of the Nasdaq decline and rebound.
Please use my analysis to this point for reference only.
I hope you operate safely, with a strict trading strategy and stop-loss orders.
Thank you.
It's a Bitcoin Guide.
If you "follow"
You can receive real-time movement paths and comment notifications on major sections.
If my analysis was helpful,
Please click the booster button at the bottom.
This is the Bitcoin 30-minute chart.
The Nasdaq indicators will be released shortly at noon.
Due to the end of Daylight Savings Time, we need to move back an hour from the previous chart.
Based on the pattern, the weekly chart reached the Bollinger Band support line,
which is a major support line.
However,
there's also pressure from the MACD dead cross on the monthly chart,
and the possibility of a Nasdaq coupling appears high during a decline.
So,
I developed today's strategy centered on the Nasdaq's lower gap retracement.
*When the red finger moves,
this is a conditional long position strategy.
1. Confirm that the purple finger touches the first section (autonomous short).
$103,375.7 long position entry point / stop loss if the light blue support line is broken.
2. $108,010.4 long position primary target -> Target prices are set at Top, then Good in that order. If the strategy is successful, 106.8K will be the point where you can re-enter a long position.
If the price falls immediately without touching the first point at the top, then the second point is the final long position.
The second point is a double bottom based on the low of this uptrend.
Based on the lower tail, the price is open from the bottom to 98.5K.
It would be wise to prepare for a failure of the Nasdaq decline and rebound.
Please use my analysis to this point for reference only.
I hope you operate safely, with a strict trading strategy and stop-loss orders.
Thank you.
Đóng lệnh: dừng lỗ
Hello,It's a Bitcoin Guide.
I'll check the movement since the analysis was written on November 4th.
This is the Nasdaq 30-minute chart.
I've marked the key areas with black fingers.
Yesterday, the strategy involved entering a short position at the top with the light blue finger,
and then switching to a long position near Gap 5.
After touching the light blue finger at point 1,
it continued to point 2 -> Gap 5, and then adjusted near the bottom before closing.
Today, a new daily candlestick was created, and the price has fallen to point 3 and is now moving sideways.
Yesterday's movement
repeated the Nasdaq's medium-term pattern,
and the MACD death cross has been imprinted on the daily chart.
This is the Bitcoin 30-minute chart. I've marked the key areas with black fingers.
In the red finger long position strategy,
after entering a short position at the top (purple finger 1st section),
the price reached $103,375.7 at the bottom, and
after breaking through the light blue support line at the second long position switching section,
it was pushed back to the bottom.
The strategy was to cut losses.
The top section (1st section) was the best short entry point,
and a double bottom was expected at the final section (2nd section),
but as expected, it coupled with the Nasdaq,
and fell sharply before rebounding.
I tried to figure out the direction, but the Nasdaq is in chaos again.
As I explained yesterday,
the current position is the major support line on the weekly Bollinger Bands,
and since the weekly candlestick is valid for one week,
it would be good to watch to see how the price moves this week.
From the current breakout, there will be pressure from the MACD dead cross on the monthly chart, so please be careful. Good luck today!
Thank you.
Ghi chú
Hello,It's a Bitcoin Guide.
I'll check the movement after writing the analysis on November 5th.
This is the Nasdaq 30-minute chart.
I don't write separate analysis articles,
but I did check the patterns and trends for this Bitcoin analysis.
If you look at the black fingers,
the market opened in the first section, and at the noon indicator release,
it touched the top section with a strong upward movement and closed.
It is currently moving sideways.
Based on Bollinger Bands, it reached the center line of the 4-hour chart, but with the intermediate-term pattern broken,
it first touched the lower Bollinger Band and is moving sideways.
It looks like further upside or downside will be determined until dawn.
This is the Bitcoin 30-minute chart. I've marked the key sections with black fingers.
In the red finger long position strategy,
after touching the first section (purple finger) at the top,
unfortunately, the long position entry section (marked with a red finger at the bottom) reached the top section target price without touching the $101,939.7 entry point.
After that, the price corrected and moved sideways.
If all goes well, there seems to be a possibility of a rebound from the current long position re-entry section (section 1).
I'll take a closer look at the overall situation.
Since the entry point was not touched, the strategy has been canceled.
I'll proceed quickly today.
Thank you.
Ghi chú
Hello,It's a Bitcoin Guide.
I'll check the movement since writing the analysis on November 6th.
This is the Nasdaq 30-minute chart.
I've marked the major sections with black fingers.
Yesterday, after the purple finger touched once,
the red finger + twice,
or the maximum bottom section, a 12+-day major support line pattern,
I was taking a long position.
The market opened at 11:30 AM,
and after the second touch of the center line of the 4-hour Bollinger Bands,
it fell vertically and then touched the bottom.
It closed without any significant rebound.
The center line of the 4-hour chart was an important point,
but usually, a rebound starts after the second touch,
and it's moving too arbitrarily.
I told you not to keep falling,
but here we go again.
This is a 30-minute Bitcoin chart.
I've marked key areas with black fingers.
The light blue finger indicates a short-to-long switch.
Or, if it immediately falls, I'm waiting for a long position in the second area.
Since the first area didn't touch the top,
after entering a long position at $101,348.6,
the green support line was not broken, and Bitcoin ended in a very sideways movement.
It would have been better if the Nasdaq had provided support.
Due to the lack of intelligence, Bitcoin hasn't even touched the center line of the 4-hour Bollinger Bands chart.
Only the bottom remains at the bottom.
Since the current movement is a rebound after touching the weekly support line,
if it breaks below the bottom,
even if it forms a double bottom,
there's a high possibility of further declines over the weekend.
From a long position standpoint, it's best to provide unconditional support.
The Nasdaq isn't doing very well at the moment,
but some people are holding long positions, so I'm writing this analysis and taking responsibility for it until the end.
The strategy is active.
While maintaining the current unfavorable position, I'll briefly discuss today's strategy.
Thank you.
Ghi chú
Hello,It's a Bitcoin Guide.
I'll check the movement since the analysis was written on November 7th.
This is Bitcoin's 30-minute chart.
I've marked the key areas with black fingers.
On the left, I've followed the strategy from the analysis on the 6th,
the final long position entry area of $101,348.6.
Since the red finger long position strategy
did not touch the first area at the top,
we've completed the second long position entry at $99,850.8.
The green support line was touched without breaking away from the top.
After moving sideways over the weekend, the price has rebounded strongly, from Good to Great, after new weekly and daily candlesticks were formed.
It's been a while since I've seen a perfect result.
The strategy was taken profit.
It's rising to just under $7,000. Last week's movement created a Gap8 zone at the bottom.
I'll closely examine what kind of movement this week will bring.
Thank you.
Ghi chú
Hello,It's a Bitcoin Guide.
I'll check the movement after writing the analysis on November 10th.
This is a 30-minute chart of the Nasdaq.
I've marked the major sections with black fingers.
While I didn't conduct a separate analysis of the Nasdaq,
I've roughly identified the movement to determine Bitcoin's entry points and direction.
The Bollinger Bands on the 1-hour chart closed with a rebound after touching the center line.
The Ichimoku Kinko Hyo on the 4-hour chart is moving sideways and adjusting with a thin positive cloud.
A gap retracement is imminent at the bottom,
but for the uptrend to continue, it's crucial that the price doesn't fall below the gap level.
I've outlined the general points.
This is a 30-minute Bitcoin chart.
I've marked the key areas with black fingers.
In the red finger long position strategy, the price reached $105,708.8 -> touched the first area and ended in extreme sideways movement.
After a new daily candlestick formed today,
the first target price was $106,866.1,
but the price is currently adjusting without touching the final target price of the top area.
Yesterday, I set a short stop loss during the upward wave,
but it was pushed back to area 1 (sideways movement).
After breaking through the pink resistance line without touching the green support line,
it reached the first target price without falling to Gap 8,
and continued to move sideways near area 1.
I proceeded with manual liquidation.
The general movement is expected,
but I hope you'll manage it wisely.
thank you.
*비트코인가이드 공식텔레그램 Telegram
t.me/BTG_Group
*빙엑스 BingX 50%DC+$5,000 (총1회수수료)
bingx.com/invite/YBM3A4
*바이비트 Bybit 20%DC+$5,020
partner.bybit.com/b/Bitcoin_Guide
*앞으로는 하단의 네이버카페에서만 활동합니다.
cafe.naver.com/loanlife82
t.me/BTG_Group
*빙엑스 BingX 50%DC+$5,000 (총1회수수료)
bingx.com/invite/YBM3A4
*바이비트 Bybit 20%DC+$5,020
partner.bybit.com/b/Bitcoin_Guide
*앞으로는 하단의 네이버카페에서만 활동합니다.
cafe.naver.com/loanlife82
Bài đăng liên quan
Thông báo miễn trừ trách nhiệm
Thông tin và các ấn phẩm này không nhằm mục đích, và không cấu thành, lời khuyên hoặc khuyến nghị về tài chính, đầu tư, giao dịch hay các loại khác do TradingView cung cấp hoặc xác nhận. Đọc thêm tại Điều khoản Sử dụng.