Bullish Catalyst Technical Signals: Breakout Validity & Momentum Accumulation
1.Key Resistance Converted to Support, Bullish Structure Confirmed
The price has stabilized above the critical 200-hour SMA level at $88,000, which has now switched from a resistance barrier to the primary support level. Together with the recent consolidation low of $87,700, it forms a dual support zone.
The daily MACD has formed a golden cross after volume contraction, with the red bars starting to expand. Combined with the gradual accumulation of momentum on the 4-hour timeframe, the rebound structure is further reinforced. Historical data shows that after breaking through the 200-hour SMA and holding steady for 24 hours, the probability of short-term upward continuation exceeds 70%.
2. Oversold Recovery Resonates with Support Levels
The daily RSI has rebounded from the oversold zone to the 38-40 range, moving out of the weak price territory. The valid support from the lower Bollinger Band has fueled the rebound; currently, the price is trading between the middle and lower bands of the Bollinger Bands, creating strong demand to move back toward the middle band.
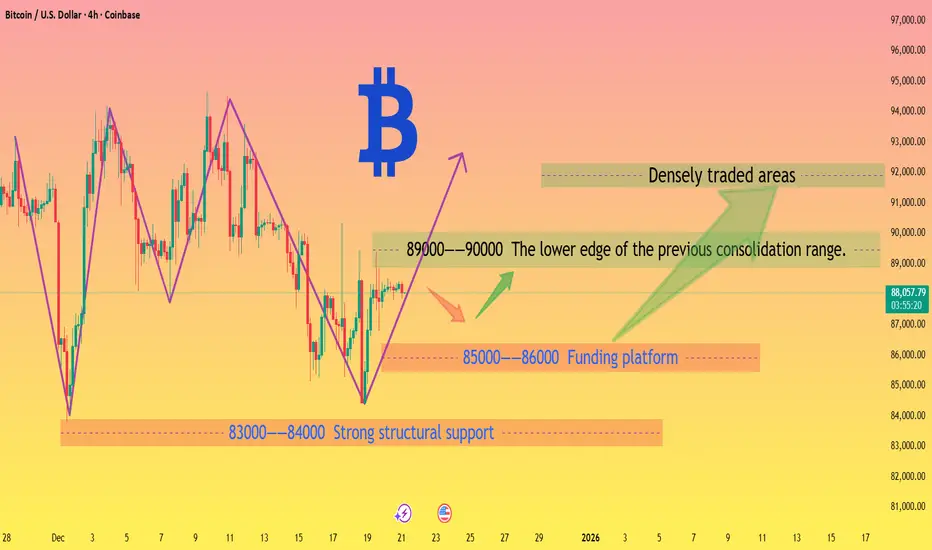
The $85,000-$86,000 range is a proven strong support level that has stood multiple tests. Coupled with robust on-chain capital absorption, it forms a bottom safety cushion, significantly reducing the risk of a sharp decline.
3. Chip Structure Provides a Support Foundation
Although high-level chips have shown signs of loosening, there have been multiple instances of capital bargain-hunting around the $85,000 level, forming a periodic concentrated chip zone that underpins the rebound. The long and short liquidations over the past 24 hours have been relatively balanced; sufficient capital game amid bull-bear divergence is conducive to the clarification of the subsequent trend.
Bitcoin trading strategy
buy:87000-88000
tp:89000-90000-92000
1.Key Resistance Converted to Support, Bullish Structure Confirmed
The price has stabilized above the critical 200-hour SMA level at $88,000, which has now switched from a resistance barrier to the primary support level. Together with the recent consolidation low of $87,700, it forms a dual support zone.
The daily MACD has formed a golden cross after volume contraction, with the red bars starting to expand. Combined with the gradual accumulation of momentum on the 4-hour timeframe, the rebound structure is further reinforced. Historical data shows that after breaking through the 200-hour SMA and holding steady for 24 hours, the probability of short-term upward continuation exceeds 70%.
2. Oversold Recovery Resonates with Support Levels
The daily RSI has rebounded from the oversold zone to the 38-40 range, moving out of the weak price territory. The valid support from the lower Bollinger Band has fueled the rebound; currently, the price is trading between the middle and lower bands of the Bollinger Bands, creating strong demand to move back toward the middle band.
The $85,000-$86,000 range is a proven strong support level that has stood multiple tests. Coupled with robust on-chain capital absorption, it forms a bottom safety cushion, significantly reducing the risk of a sharp decline.
3. Chip Structure Provides a Support Foundation
Although high-level chips have shown signs of loosening, there have been multiple instances of capital bargain-hunting around the $85,000 level, forming a periodic concentrated chip zone that underpins the rebound. The long and short liquidations over the past 24 hours have been relatively balanced; sufficient capital game amid bull-bear divergence is conducive to the clarification of the subsequent trend.
Bitcoin trading strategy
buy:87000-88000
tp:89000-90000-92000
Giao dịch đang hoạt động
The battle between bulls and bears at key support and resistance levels for Bitcoin.🌞🌞🌞The market only moves in one direction, neither bullish nor bearish, but in the right direction.✔✔✔
📶📶📶Free trading signals:t.me/+Yxg-9qunpEA5YmU0
📶📶📶Free trading signals:t.me/+Yxg-9qunpEA5YmU0
Thông báo miễn trừ trách nhiệm
Thông tin và các ấn phẩm này không nhằm mục đích, và không cấu thành, lời khuyên hoặc khuyến nghị về tài chính, đầu tư, giao dịch hay các loại khác do TradingView cung cấp hoặc xác nhận. Đọc thêm tại Điều khoản Sử dụng.
🌞🌞🌞The market only moves in one direction, neither bullish nor bearish, but in the right direction.✔✔✔
📶📶📶Free trading signals:t.me/+Yxg-9qunpEA5YmU0
📶📶📶Free trading signals:t.me/+Yxg-9qunpEA5YmU0
Thông báo miễn trừ trách nhiệm
Thông tin và các ấn phẩm này không nhằm mục đích, và không cấu thành, lời khuyên hoặc khuyến nghị về tài chính, đầu tư, giao dịch hay các loại khác do TradingView cung cấp hoặc xác nhận. Đọc thêm tại Điều khoản Sử dụng.