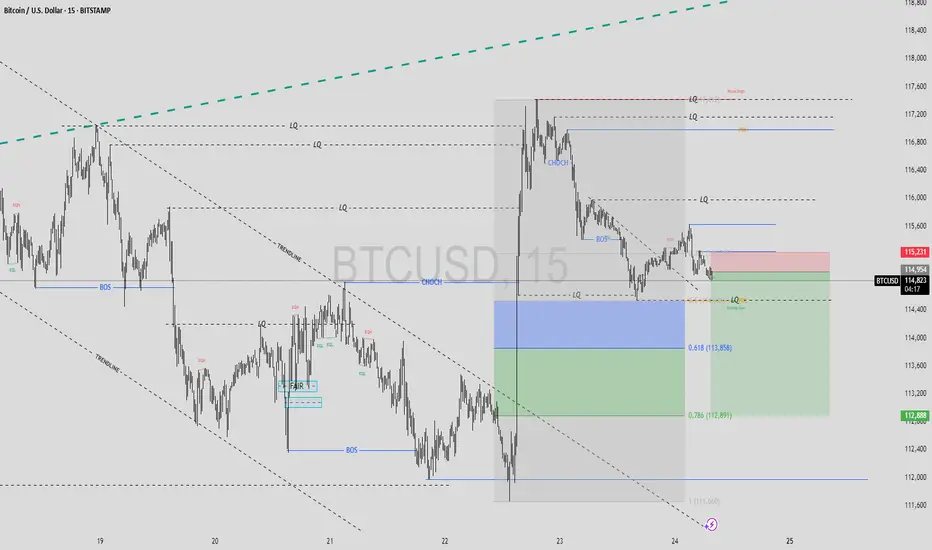
Looking at this BTC/USD 15-minute chart, price recently broke structure and shifted with a change of character (CHOCH), now trading below a key trendline. After retesting resistance near 115,231, BTC is starting to slip lower, with eyes on liquidity zones and Fibonacci retracement levels around 113,858 and 112,891. If selling pressure continues, the next strong support could be found in this area. Watch for reactions at these zones, as a bounce might trigger a reversal, but until then, bearish momentum looks dominant.
This analysis is for educational purposes only and does not constitute financial advice. Trading involves risk, and you should conduct your own research or consult a financial advisor before making any trading decisions.
This analysis is for educational purposes only and does not constitute financial advice. Trading involves risk, and you should conduct your own research or consult a financial advisor before making any trading decisions.
Thông báo miễn trừ trách nhiệm
Thông tin và ấn phẩm không có nghĩa là và không cấu thành, tài chính, đầu tư, kinh doanh, hoặc các loại lời khuyên hoặc khuyến nghị khác được cung cấp hoặc xác nhận bởi TradingView. Đọc thêm trong Điều khoản sử dụng.
Thông báo miễn trừ trách nhiệm
Thông tin và ấn phẩm không có nghĩa là và không cấu thành, tài chính, đầu tư, kinh doanh, hoặc các loại lời khuyên hoặc khuyến nghị khác được cung cấp hoặc xác nhận bởi TradingView. Đọc thêm trong Điều khoản sử dụng.