🔍 Price snapshot:
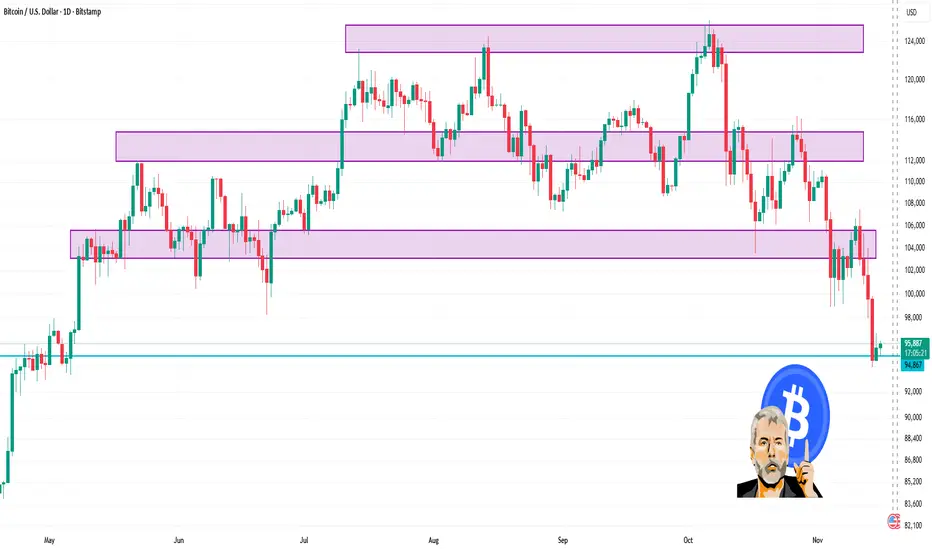
1. It’s trading in the vicinity of ~US$95,900 (as per latest data) per coin.
2. Daily range (roughly) sits between ~US$94,800 and ~US$96,400 (depending on source).
3. Technical summary on the daily timeframe is leaning toward a “Strong Sell / Sell” bias per one analytics page.
📌 Key levels to watch (daily chart):
1. Support zone: Around the US$94,000–95,000 area (recent lows)
2. Resistance zone: Around the US$100,000 + region (psychological + prior highs)
3. Because the data shows price trading below ~US$100,000 and bouncing near US$95,000, the latter areas act as important anchors.
Bài đăng liên quan
Thông báo miễn trừ trách nhiệm
Thông tin và các ấn phẩm này không nhằm mục đích, và không cấu thành, lời khuyên hoặc khuyến nghị về tài chính, đầu tư, giao dịch hay các loại khác do TradingView cung cấp hoặc xác nhận. Đọc thêm tại Điều khoản Sử dụng.
Bài đăng liên quan
Thông báo miễn trừ trách nhiệm
Thông tin và các ấn phẩm này không nhằm mục đích, và không cấu thành, lời khuyên hoặc khuyến nghị về tài chính, đầu tư, giao dịch hay các loại khác do TradingView cung cấp hoặc xác nhận. Đọc thêm tại Điều khoản Sử dụng.