BTCUSD Technical Analysis – Break of Structure + Support/Resistance Strategy
🔍 Market Structure Insight
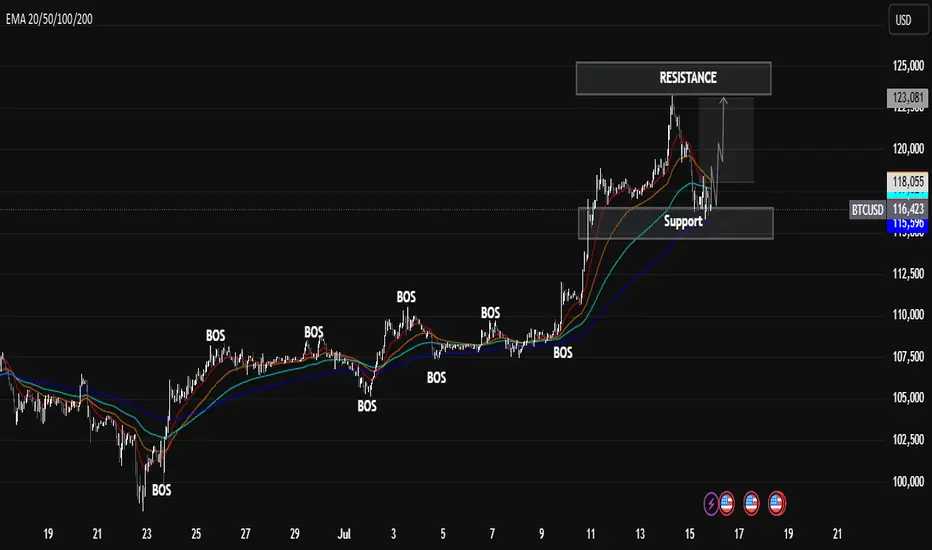
The chart clearly shows multiple Breaks of Structure (BOS) throughout the uptrend, indicating strong bullish momentum. Each BOS confirms a higher high formation and continued market strength.
📌 Key Zones
Resistance Zone: Price recently tested this level and faced rejection, indicating potential short-term selling pressure.
Support Zone: Price is currently retesting this level after a correction, showing signs of a possible bounce. It aligns well with the EMA support cluster (20–200 EMAs).
🔄 Current Price Action
After a significant impulse move to the upside, BTC is now in a corrective phase. However, the support zone is holding, and there's potential for a new bullish wave if price sustains above $115,000.
📈 Bullish Scenario
Price holds above support
EMA cluster continues to act as dynamic support
Break above $118,000 resistance could trigger the next rally toward $122,000+
🔍 Market Structure Insight
The chart clearly shows multiple Breaks of Structure (BOS) throughout the uptrend, indicating strong bullish momentum. Each BOS confirms a higher high formation and continued market strength.
📌 Key Zones
Resistance Zone: Price recently tested this level and faced rejection, indicating potential short-term selling pressure.
Support Zone: Price is currently retesting this level after a correction, showing signs of a possible bounce. It aligns well with the EMA support cluster (20–200 EMAs).
🔄 Current Price Action
After a significant impulse move to the upside, BTC is now in a corrective phase. However, the support zone is holding, and there's potential for a new bullish wave if price sustains above $115,000.
📈 Bullish Scenario
Price holds above support
EMA cluster continues to act as dynamic support
Break above $118,000 resistance could trigger the next rally toward $122,000+
Đóng lệnh: đạt mục tiêu
✅ BTC Half Target Achieved!Price reacted perfectly from our key zone — setup remains active and on track.
Monitoring for full target
Expert Gold Analyst | XAU/USD
Mastery Unlock trading success with premium strategies!
Exclusive signals & live trades.& pro education
Daily updates for all VIP members Join our active Telegram traders hub: t.me/Mentor_Michael033
Mastery Unlock trading success with premium strategies!
Exclusive signals & live trades.& pro education
Daily updates for all VIP members Join our active Telegram traders hub: t.me/Mentor_Michael033
Thông báo miễn trừ trách nhiệm
Thông tin và các ấn phẩm này không nhằm mục đích, và không cấu thành, lời khuyên hoặc khuyến nghị về tài chính, đầu tư, giao dịch hay các loại khác do TradingView cung cấp hoặc xác nhận. Đọc thêm tại Điều khoản Sử dụng.