🔍 Technical Highlights:
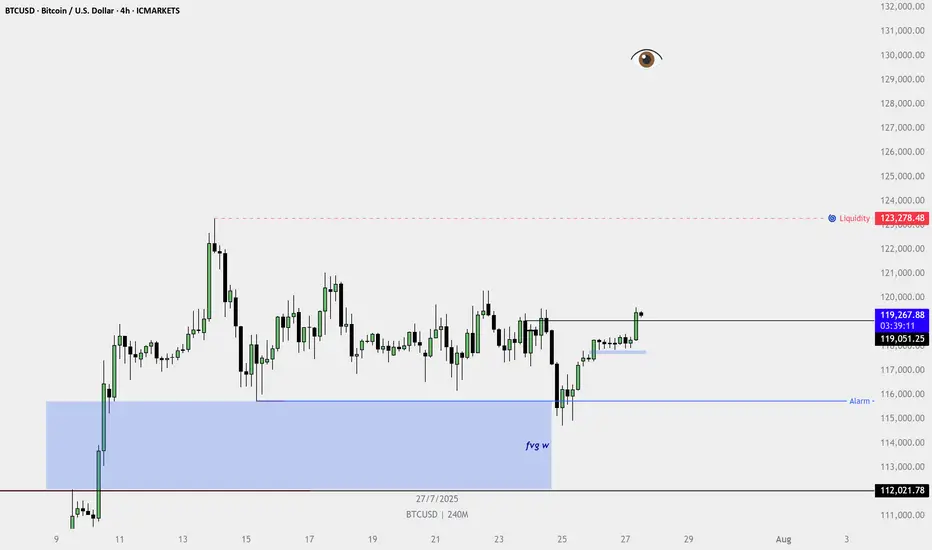
HTF FVG Tap (Marked as "fvg w"):
Price reacted strongly from the weekly fair value gap, indicating institutional buying interest from a higher timeframe demand zone.
Higher Low + Bullish Break:
Price formed a higher low and broke above the recent swing high, confirming a shift to bullish structure.
4H Bullish FVG Formed:
After the breakout, a fresh bullish FVG formed on the 4H chart — a classic sign of momentum and continuation.
Breaker Structure Confirmed:
Price closed above a series of bearish candles, confirming buyer strength and trapping late sellers.
Internal Liquidity Taken:
The range-bound consolidation (chop) has been swept, clearing out internal liquidity and fueling the breakout.
I am an SMC & ICT Master, specializing in Market Structure, Liquidity, and Order Flow. With a razor-sharp focus on precision trading, I navigate the markets with strategy and discipline—turning probabilities into profitability!
Thông báo miễn trừ trách nhiệm
Thông tin và ấn phẩm không có nghĩa là và không cấu thành, tài chính, đầu tư, kinh doanh, hoặc các loại lời khuyên hoặc khuyến nghị khác được cung cấp hoặc xác nhận bởi TradingView. Đọc thêm trong Điều khoản sử dụng.