1) Market Structure
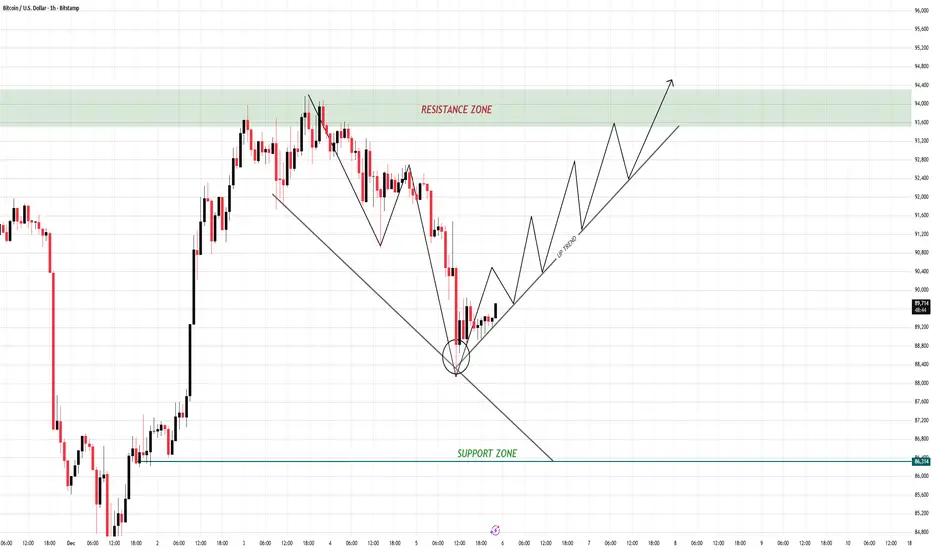
- After a strong sell-off, BTC formed a new low and immediately bounced from a confluence zone of trendline + support (circled area).
- The previous move was a descending structure, but the sharp rebound signals the formation of a first Higher Low → a clear early sign of trend reversal.
- Price has slightly broken the descending trendline and is now retesting it, building the foundation for a bearish → bullish structure shift.
2) Key Levels
Support Zone:
Strong support around 86,300, where the price rejected and reversed.
Resistance Zone:
Major resistance between 93,600 – 94,400, previously a strong rejection area.
Uptrend Line:
- A new uptrend line is forming.
- Every pullback toward this trendline → a potential long opportunity.
3) Scenarios
✅ Main Scenario (Bullish – High Probability)
As long as BTC holds the circled support area and continues forming Higher Highs & Higher Lows, the uptrend remains intact.
Strategy: wait for pullbacks to the trendline to enter long positions.
Targets:
TP1: retest 93,600
TP2: break higher into 94,400
❌ Invalidation Scenario (Bearish)
- If price breaks below the uptrend line and falls back toward 86,300, the bullish structure fails.
- That would signal a deeper correction or a full bearish continuation.
4) Summary
BTC has bounced off a critical support zone with clear signs of a trend reversal. The bullish structure is forming, and pullbacks to the uptrend line will be the key opportunities.
The market rewards discipline — wait for your setup, then execute with confidence
MY COMMUNITY GROUP GET FREE SIGNAL
✅ 100% Free — I don’t take a penny from anyone
✅ Free Signal: 4 - 6 signals
✅ Trading Idea / Setup / Technical
✅ JOIN MY COMMUNITY GROUP IN Telegram:
t.me/+vxDQ4bhDfsw3MGU1
✅ 100% Free — I don’t take a penny from anyone
✅ Free Signal: 4 - 6 signals
✅ Trading Idea / Setup / Technical
✅ JOIN MY COMMUNITY GROUP IN Telegram:
t.me/+vxDQ4bhDfsw3MGU1
Bài đăng liên quan
Thông báo miễn trừ trách nhiệm
Thông tin và các ấn phẩm này không nhằm mục đích, và không cấu thành, lời khuyên hoặc khuyến nghị về tài chính, đầu tư, giao dịch hay các loại khác do TradingView cung cấp hoặc xác nhận. Đọc thêm tại Điều khoản Sử dụng.