Followup to my bigger picture plot posted here (click).
Retrace started exactly where it was "supposed" to (see above link).
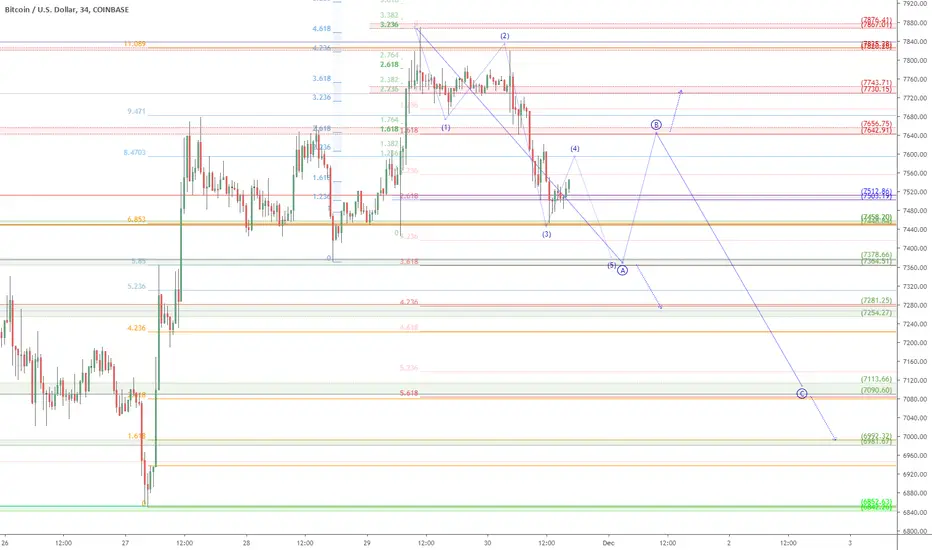
The pullback appears to be significant and possibly a big correction.
Question of which wave is retracing (last small one or entire bounce).
An alternate view would be to consider retrace done.
If and when such signs appear, I will try to post as such.
But the exact turn was predicted thus my faith in this one.
$ 7503 - 7513 (blue) is the KEY zone to to confirm or deny the paths.
$ 7642 - 7656 (red) should be pretty strong resistance if retrace is real.
$ 7730 - 7745 (red) is the maximum expected, or the plot is invalid.
Part of my ongoing Bitcoin analysis, been hitting every important turn (click):
7860 Retrace Call
7650 Resistance Map
6850 Bounce plot
5882 critical number
8700 Top Call
21k possible target (still possible)
9k bounce call
14k target call <=Perfect TP
10k target call
7.5k bounce call
3.1k bottom call (EXACT 2018 bottom)
Of course, I have had total FAILS on some ideas too, not going to pretend.
But all of my plots show PRECISE entries, TIGHT stops, and EXACT targets.
Precision is the way of the Fib. Almost every turn happens at a Fib Line.
.
Retrace started exactly where it was "supposed" to (see above link).
The pullback appears to be significant and possibly a big correction.
Question of which wave is retracing (last small one or entire bounce).
An alternate view would be to consider retrace done.
If and when such signs appear, I will try to post as such.
But the exact turn was predicted thus my faith in this one.
$ 7503 - 7513 (blue) is the KEY zone to to confirm or deny the paths.
$ 7642 - 7656 (red) should be pretty strong resistance if retrace is real.
$ 7730 - 7745 (red) is the maximum expected, or the plot is invalid.
Part of my ongoing Bitcoin analysis, been hitting every important turn (click):
7860 Retrace Call
7650 Resistance Map
6850 Bounce plot
5882 critical number
8700 Top Call
21k possible target (still possible)
9k bounce call
14k target call <=Perfect TP
10k target call
7.5k bounce call
3.1k bottom call (EXACT 2018 bottom)
Of course, I have had total FAILS on some ideas too, not going to pretend.
But all of my plots show PRECISE entries, TIGHT stops, and EXACT targets.
Precision is the way of the Fib. Almost every turn happens at a Fib Line.
.
Ghi chú
PING .
Ghi chú
We have a wee bit of a bounce .
Ghi chú
Last leg down on 1min , 4.618 can be end of a wave .
Ghi chú
We are at a pretty rigid support as evidence by the sudden halt in the drop .
Ghi chú
pretty cool .
Ghi chú
Bounce is still holding, about 1 hour after the drop's abrupt halt .
Ghi chú
so much for that support show above :(Looks like we are heeded to the $7250 area
.
Ghi chú
Ping .
Ghi chú
Once again the support is holding for a few candles .
Ghi chú
Support seems to be holding a little better than the last one So adjusting the EW positions from original plot:
And we have two significant resistances before we even get to that round number...
But wave B's (if get a real one) can be surprising, they start with shorts taking profit, then bulls jump in, until more shorts take profit, etc.
It is also possible (but not likely imo) that correction is done, we consolidate here for a while, then resume uptrend.
If correction is done, we should see "impulsive" waves upwards next...
.
Ghi chú
So the support from above snap held and bounce it into the resistances above But would have been nice to have held the 7364-7378 zone.
Am assessing the latest pullback now to look for clues.
.
the Golden Ratio is my Religion
the Trading View is my Nation
the Moderator Tag is my Flag
the Trading View is my Nation
the Moderator Tag is my Flag
Bài đăng liên quan
Thông báo miễn trừ trách nhiệm
Thông tin và ấn phẩm không có nghĩa là và không cấu thành, tài chính, đầu tư, kinh doanh, hoặc các loại lời khuyên hoặc khuyến nghị khác được cung cấp hoặc xác nhận bởi TradingView. Đọc thêm trong Điều khoản sử dụng.