Ha! I kid, I kid. There is no holy grail indicator.
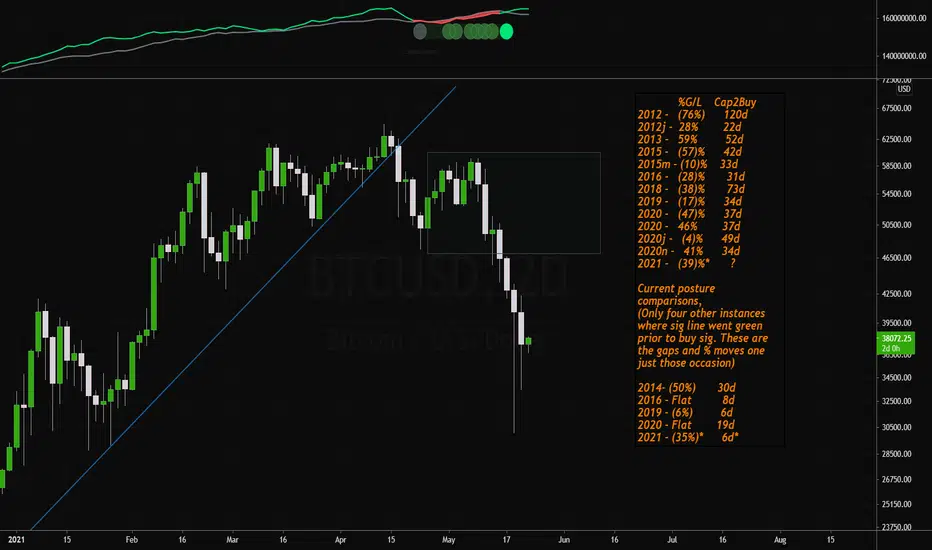
In this post, I dive deep into the deets on the hash ribbon indicator and want to share my results. The box drawn on the chart is plotting the average resolution time. Also the percent moves are maximum moves, peak to trough and vice versa. The rest should be detailed enough.
Legend:
G/L = gain/loss
Cap2Buy = The time between capitulation signal and the buy signal.
...d = Days. ie, 304d is 304 days.
...d* = Same as above but is up to date data and will change in the future with more data.
Happy trading and feel free to ask me any questions!
Ghi chú
Check me out at No Noiz on YT for live shows as well!Thông báo miễn trừ trách nhiệm
Thông tin và ấn phẩm không có nghĩa là và không cấu thành, tài chính, đầu tư, kinh doanh, hoặc các loại lời khuyên hoặc khuyến nghị khác được cung cấp hoặc xác nhận bởi TradingView. Đọc thêm trong Điều khoản sử dụng.
Thông báo miễn trừ trách nhiệm
Thông tin và ấn phẩm không có nghĩa là và không cấu thành, tài chính, đầu tư, kinh doanh, hoặc các loại lời khuyên hoặc khuyến nghị khác được cung cấp hoặc xác nhận bởi TradingView. Đọc thêm trong Điều khoản sử dụng.