Chart Analysis
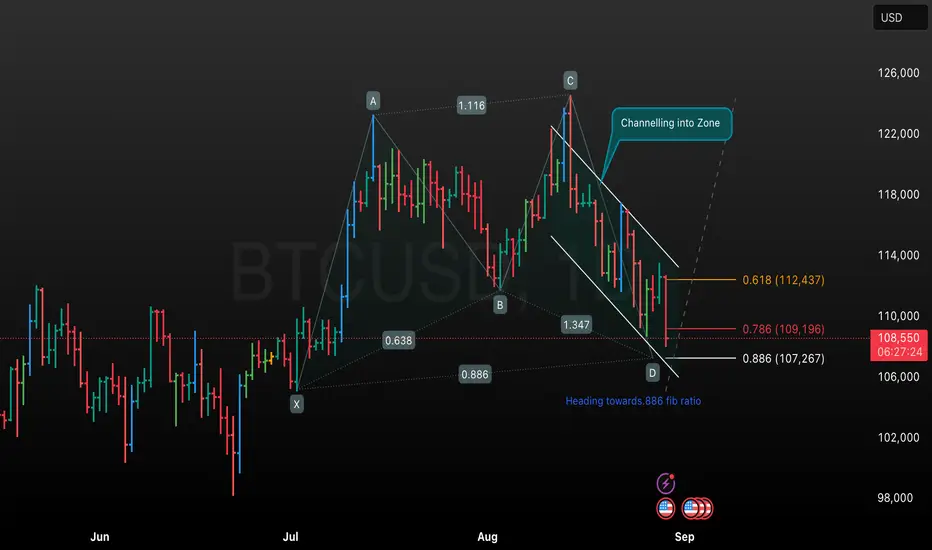
• The chart uses a harmonic pattern (possibly a Bat or Gartley pattern) marked by the points X, A, B, C, and D, with each leg labeled with its Fibonacci ratio (e.g., AB: 0.638, BC: 1.347, CD targeting 0.886).
• A trend channel is highlighted with the annotation “Channelling into Zone,” indicating price action is moving within a defined support and resistance path downwards.
• The two major Fibonacci retracement/support levels indicated are:
• 0.618 (112,437): This is a classic Fibonacci resistance zone where price may face strong selling pressure if it bounces.
• 0.786 (109,196): Another retracement level and a commonly watched zone for harmonic patterns.
• 0.886 (107,267): This is the final target for the D point in many harmonic patterns (such as a Bat), where a reversal is often anticipated.
• Price is currently at 108,429 USD, trading below both the 0.618 and 0.786 Fibonacci retracement levels, and approaching the 0.886 target, suggesting further downside is possible but a reversal could occur near the D point.
• The overall tone is slightly bearish until price reaches the projected D point (near 107,267), where traders might look for potential long setups if a reversal confirmation appears.
Key Observations
• Bearish channel: The trend is currently down, with price respecting the channel boundaries.
• Fibonacci confluence: Critical Fibonacci levels may offer support/resistance and act as potential reversal zones.
• Pattern completion: A harmonic pattern projects an oversold zone near the 0.886 ratio, often resulting in a corrective or reversal move.
• Watch for reversal confirmation: If price action shows support at or near the 0.886 Fibonacci zone, a bullish reversal is likely according to harmonic trading principles.
This analysis assumes familiarity with harmonic patterns, Fibonacci retracement, and candlestick channels as used in technical trading.
Thông báo miễn trừ trách nhiệm
Thông tin và ấn phẩm không có nghĩa là và không cấu thành, tài chính, đầu tư, kinh doanh, hoặc các loại lời khuyên hoặc khuyến nghị khác được cung cấp hoặc xác nhận bởi TradingView. Đọc thêm trong Điều khoản sử dụng.
Thông báo miễn trừ trách nhiệm
Thông tin và ấn phẩm không có nghĩa là và không cấu thành, tài chính, đầu tư, kinh doanh, hoặc các loại lời khuyên hoặc khuyến nghị khác được cung cấp hoặc xác nhận bởi TradingView. Đọc thêm trong Điều khoản sử dụng.